Sure, having a growth strategy for LinkedIn is important, but what's the point if you don't know if it works?
Although numbers often seem boring and intimidating, they are your best friends on this path.
They can provide valuable insights into what you are doing badly and what you are doing well, and that is much easier if you have a tool that will analyze your profile for you.
We've prepared 4 free LinkedIn Analytics tools in this post that can assist you with analytics, either for free or through paid plans.
Give it a read, and choose your best solution!
1. AuthoredUp

A tool that supports you at every stage of content creation holds great value, doesn't it?
We have just the one for you!
AuthoredUp is a LinkedIn content creation and analytics tool made to improve your LinkedIn presence.
This tool covers every stage of your creation, from post creation, through scheduling to detailed analysis.
Let’s see how AuthoredUp can help you track and improve your LinkedIn performance in terms of analytics!
1. Profile Analysis
When you go to the Analytics tab the first thing is your profile performance overview. It tracks your impressions, reactions, comments, shares, and engagement rate.
You get these data in three values: median, average, and total.

2. Post Analysis
Ever wondered how your content evolves over time?
Well, now you can see that!
In this section, there are three interconnected graphs:
⚡Growth Timeline - It allows you to choose a specific dimension and compare the post to the timeline for that specific dimension. Right next to it, you can see the Post Highlight section and it allows you to see more specific details about a post. You can check mentions, hashtags, and links that you used.

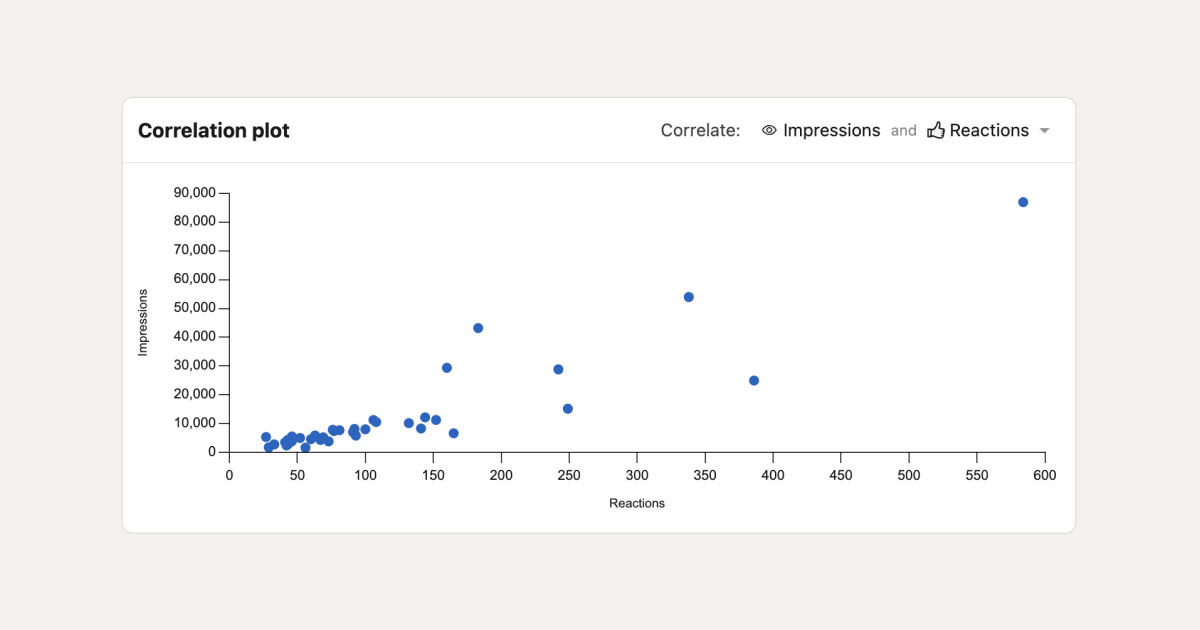
⚡Correlation Timeline - Here, you can see the relationship between two variables for a specific post.
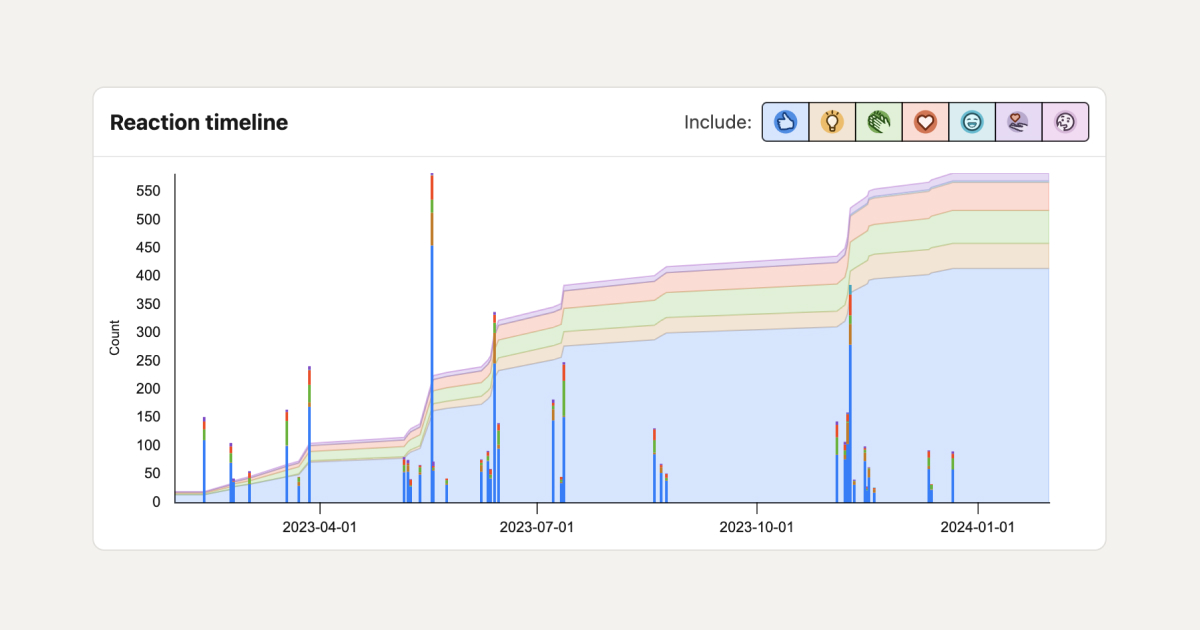
⚡Reaction Timeline - This timeline shows you the emotion that people had when they reacted to your post.
Additionally, AuthoredUP provides you with Post Type analysis, allowing you to determine the most effective post type—posts with photos or videos, for instance.
3. Hashtag Performance Analytics
Have you ever wondered why people use hashtags on Linkedin?
Since hashtags are frequently used to search for topics, this is one approach to attract people to your profile.
In this section, you can see hashtags and topics that worked well for your audience.
This is great intel as you gain valuable info about which type of content your audience loves so you can create it again.
Additional Features
Besides Analytics, AuthoredUp offers you additional features to help you grow on LinkedIn.
🚀Preview your posts seamlessly on various devices.
🚀Craft compelling text using bold and italic formatting, bullets, and more.
🚀Easily switch between multiple drafts, jot down notes, or schedule posts for later.
🚀Access a diverse range of 200+ hooks and 100+ CTA templates (available in English, Dutch, and German).
🚀Save snippets of text as templates for reuse across multiple posts.
🚀Organize all your LinkedIn posts and their statistics, including historical data.
🚀Effortlessly repost any content with a single click.
🚀Ensure your content is easily scannable and digestible with our readability score.
🚀Streamline the management of multiple LinkedIn profiles in one centralized location.
🚀Easily manage your planned content with our new Content Calendar.
Pricing
Although it is not always a free alternative, the 14-day free trial version allows you to evaluate all features of the tool before opting to upgrade to a paid plan.

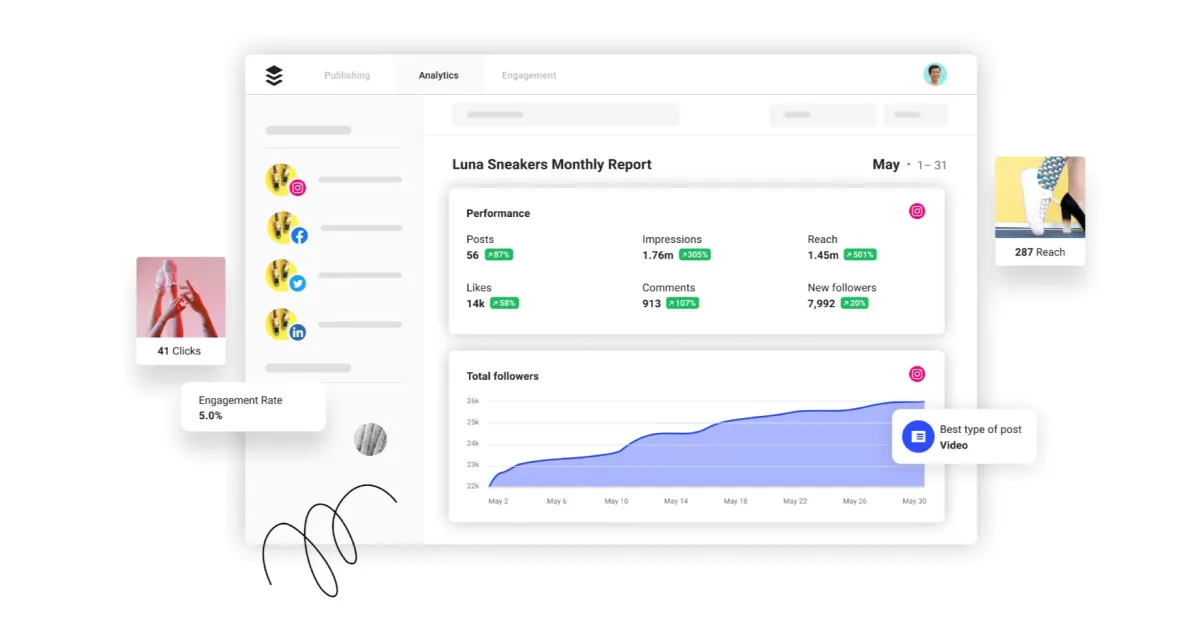
2. Buffer

Buffer is a social media management tool created to handle multiple platforms, including Twitter, Facebook, Mastodon, Instagram, Pinterest, and LinkedIn.
Besides scheduling posts, it serves as an analytics platform, allowing you to measure social media performance and generate reports.
With Buffer, you can not only gain insights but also get recommendations to improve your reach, engagement, and overall sales strategy.
Let’s see which data you can get with Buffer!
1. Content Analysis
Buffer can assist you in understanding your success across numerous accounts as well as providing detailed information on other social channels besides LinkedIn.
Here you can:
⚡Compare the outcomes between paid promotions and organic reach for boosted posts
⚡Monitor engagement metrics for every social account
⚡Check the performance of individual posts and hashtags
Isn't it much easier to track the performance of multiple accounts this way?
2. Data Analysis
Buffer's analytics function analyzes your data and recommends when, what, and how frequently you should post. Besides that, you can:
⚡Determine which types of posts—pictures, text, links, or videos—work best for you
⚡Calculate the optimal posting frequency

Additional Features
There is more to Buffer than just Analytics:
🚀Manage and publish your content across multiple channels through a dashboard
🚀Repurpose your existing posts
🚀Easily track and respond to comments
🚀Identify posts with unanswered comments
🚀Create a landing page
Pricing

Buffer offers you a free plan and three paid plans.
3. SocialChamp
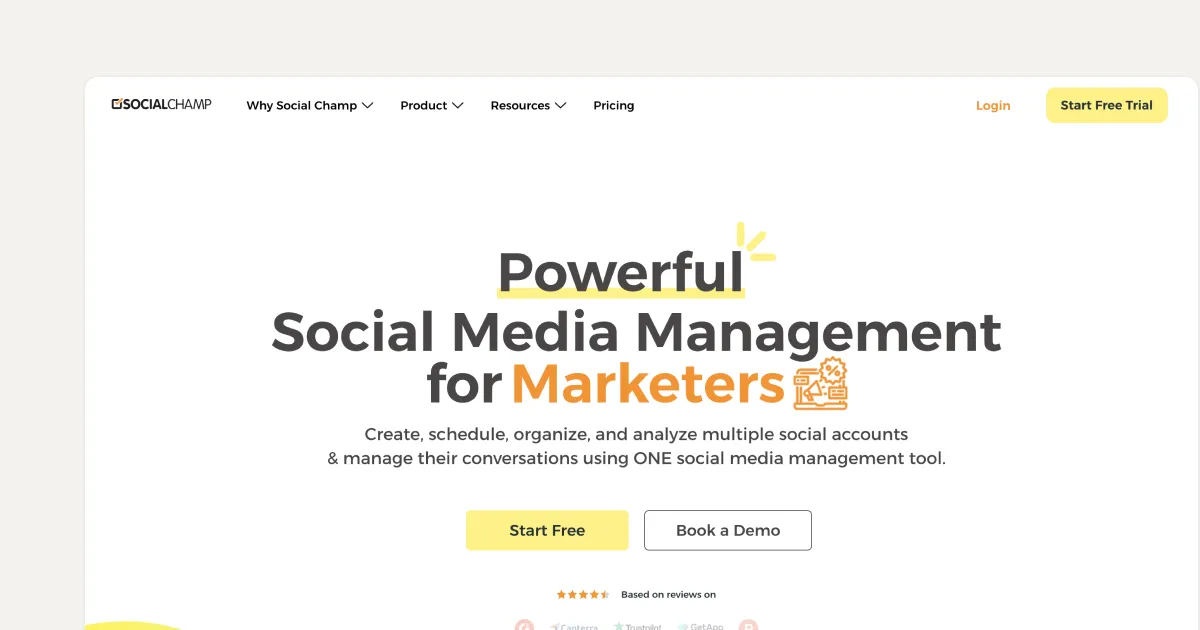
Social Champ is a social media management and automation tool that assists you in creating, managing, and scheduling posts across all of your social networks.
You may schedule posts on Facebook, Instagram, Google My Business, Twitter, Pinterest, and LinkedIn using SocialChamp.
Let’s check its analytics features!
1. Weekly & Monthly Performance
Have you ever considered how dynamic your social networks are? If so, SocialChamp can get you an answer to that question!
You may monitor overall activity on your social networks and:
⚡Compare the results on a weekly and monthly basis
⚡Get a summary of your active audiences and engagement across all social media posts
⚡Compare the content from the past with the current
⚡Obtain unique graphs for your YouTube, TikTok, Instagram, LinkedIn, Pinterest, Facebook, and TikTok pages
2. Track Top Performing Posts
Gain a deeper understanding of your audience by analyzing your best-performing content.
Keep track of your best-performing posts to help you identify, assess, and refine your social media marketing approach.
You can download these reports in PDF or PPT format, or export them to CSV.
Here you can:
⚡View the most popular posts that have been published
⚡Repost them straight from the dashboard
This allows you to quickly see what works best for your audience and encourages you to do the same.
Additional Features
SocialChamp offers you more than just analytics features.
It also allows you to::
🚀Use a visual planner to manage and organize all of your posts
🚀Easily keep an eye on and handle all incoming communications across all social media sites
🚀Share accounts with team members for viewing, managing, and collaborating without disclosing passwords
Pricing
You can use SocialChamp for free or choose some of the paid tiers.

4. DataBox
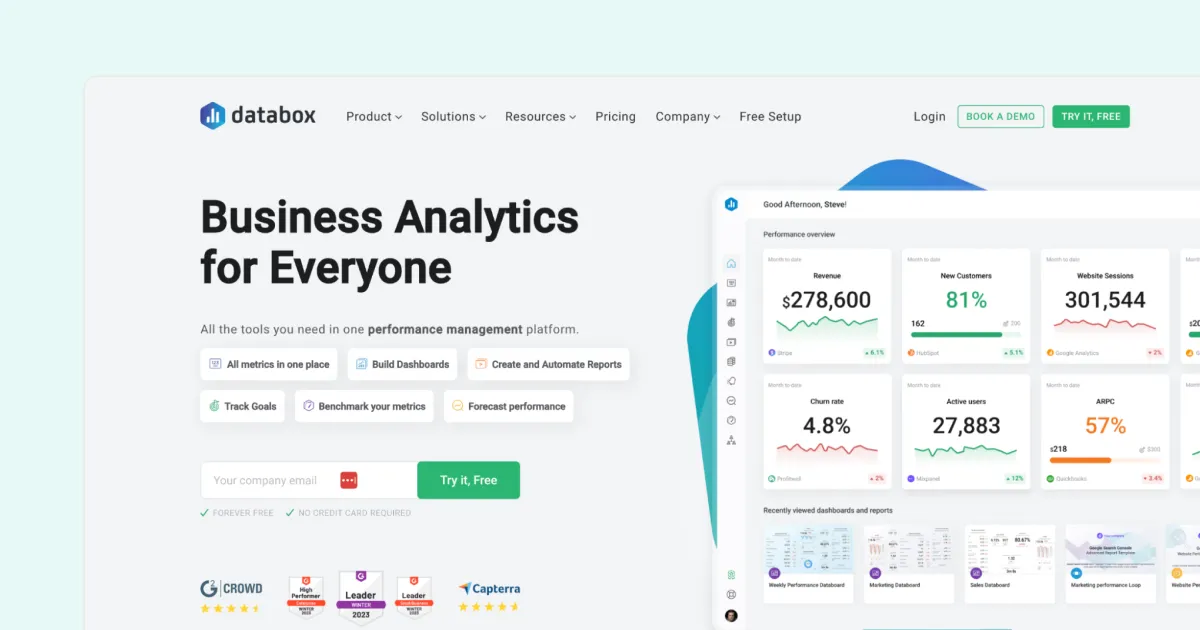
Databox organizes your most critical data into customizable dashboards.
It lets you connect up to three data sources and create up to three dashboards for free before paying on a sliding scale.
Let’s see what you can track with this tool!
1. Metric Tracking
From the Metrics Screen, you can add, organize, and monitor all of your metrics with Databox. Your Metrics Screen is a compilation of all of your most essential metrics, all of which are accessible and navigable from a single screen.
There's no need to switch between dashboards.
In this section, you can:
⚡Monitor the effectiveness of your LinkedIn Company Pages using 24 unique metrics
⚡View a list of your most recent posts**,** together with the number of impressions and clicks each one has earned
⚡Obtain the geographical and seniority demographics of your LinkedIn followers
⚡Check the progress of overall impressions, clicks, and follows
⚡See upward and downward trends as well as daily fluctuations for several time periods
⚡Recognise and reward excellent performance while identifying and correcting underperformance
⚡You can easily find any metric, organize them by using tags (marketing, sales, support, etc.), and filter by department
⚡Search by metric name or view 4,000+ metrics from Metric Library. Then, with a single click, you can add any metric to your Metrics Screen.
2. Business Goal Tracking
With Databox, you can define goals for any of the metrics (from any of the data sources) you’re already measuring.
You may monitor and oversee your objectives from a single screen, or use your dashboards to see how your goals are progressing towards any given measure.
This feature allows you to:
⚡Utilize dashboards to evaluate the effectiveness of various metrics
⚡Receive notifications when your goals veer off course
⚡Set monthly goals and have the weekly and daily targets calculated automatically
⚡Set goals for the following weeks, months, and quarters
⚡Keep track of your goal history
Remember, it is much easier to achieve your goals if you have them clearly defined.
3. KPI Tracking
KPI is an abbreviation for key performance indicator, which is a quantitative measure of performance over time for a specified goal.
KPIs provide goals for teams to strive for, milestones to track progress, and insights to help individuals throughout the organization make better decisions.
It sounds worth tracking, right?
Within Databox, you can:
⚡Receive notifications when crucial KPIs increase or drop by a certain percentage
⚡Get notified if your ad budget runs out, your website bounce rate increases or your sales activity decreases from week to week
⚡Set alerts to notify you anytime specified metrics are greater/less than a specific value throughout a specific time period of your choosing
4. Data Calculations
Data Calculations allows you to simply aggregate data from numerous sources and create new metrics, KPIs, conversion rates, and ROI.
Let’s see the value of this feature!
⚡Recognise significant opportunities and make connections by calculating conversion rates (such as visit-to-signup and sign-up-to-paid rates, among others).
⚡Compute key performance indicators such as lifetime value (LTV), customer acquisition cost (CAC), average revenue per user (ARPU), and return on advertising spend (ROAS).
With this tool, you can always see where your money was put and whether it was profitable.
Additional Feature
Let’s see what you can do with Databox besides analyzing.
🚀Schedule the sending of reports and reminders
🚀Get visually appealing reports
🚀Use the Dashboard Designer to modify any of their 200+ dashboard templates
🚀Using simple drag-and-drop features, you can personalize your dashboard
🚀Create company dashboards using your color palette and logo
🚀And more
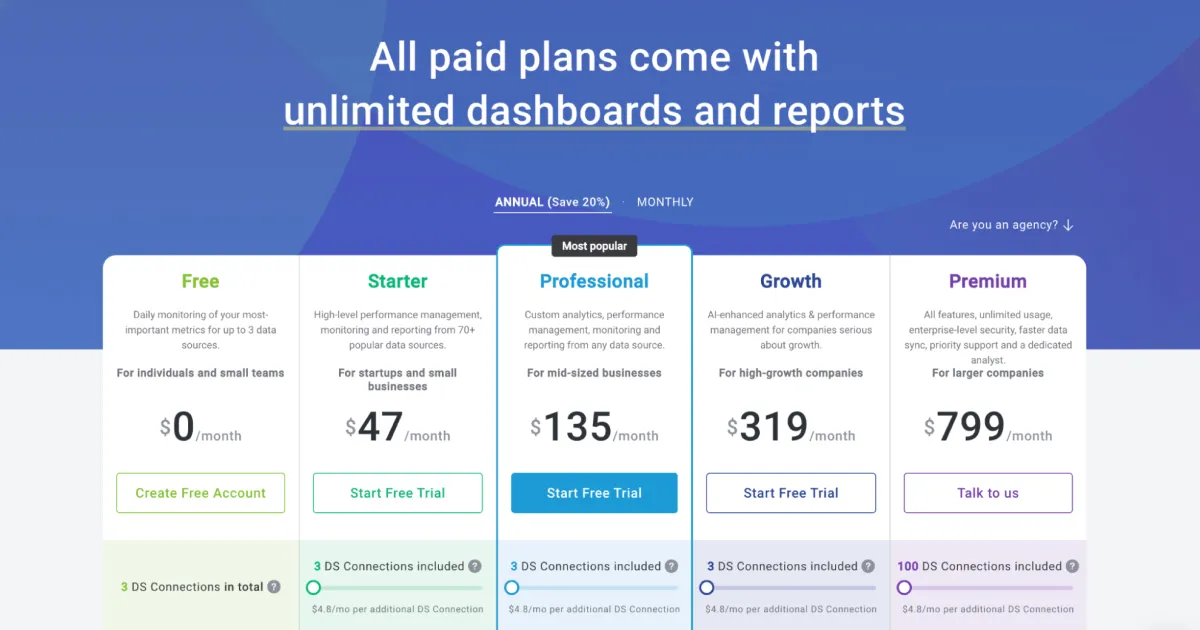
Pricing
Besides the free plan that Databox provides you with, you can choose between 4 paid plans.
To Wrap Up
If you're in search of the perfect tool for LinkedIn, look no further than AuthoredUp’s extension.
You wonder why?
Because:
✨It is solely concentrated on LinkedIn
✨It is the only tool available that does not take cookies and does not automate activity
✨It works as a layer over your LinkedIn profile, and that eliminates the need for troublesome switching between tabs
Just picture having your content strategy, analytics, and planning seamlessly integrated into a single, convenient platform.
Your job would become a piece of cake, right?
How To Start With AuthoredUp?
To get started with a free trial and see if it fits your needs, follow these steps:
- Pick your plan (no credit card required)
- Fill in the signup form
- Verify your email
- Install the extension
- Connect your LinkedIn profile
- Start measuring your LinkedIn performance
Sign up today to elevate your LinkedIn presence!