Have you ever wondered why LinkedIn numbers, which can greatly impact your career on the platform, receive so much attention?
You're not alone!
Many still underestimate their significance while expecting excellent results just from their efforts.
Ideally, you've already developed a LinkedIn strategy because, without one, you have nothing to measure.
Today, we'll guide you through the essential LinkedIn metrics to track and maximize your reach, stay relevant, and appear in your target audience's feeds.
Let's dive in!
What is LinkedIn Analytics?
LinkedIn Analytics is a set of tools that helps its users measure and analyze the performance of their profiles and posts on the platform.
It offers valuable insights into:
- how many people view your profile,
- how many of them interact with your content, and
- where your audience comes from.
This information is crucial for users looking to optimize their presence, enhance their content strategies, and build stronger professional connections.
Benefits of Understanding LinkedIn Metrics
By understanding LinkedIn metrics, you can make informed decisions to improve your visibility and engagement on LinkedIn.
This approach ultimately helps people like you achieve their career and business goals.
Let’s review which benefits you can count on when monitoring your performance on the Company Page and your LinkedIn profile.
Benefits For Individuals
✔️ Personal Branding — Metrics identify which parts of your profile are most effective, guiding enhancements to strengthen your professional image.
✔️ Networking Opportunities — Analytics reveal who is viewing and interacting with your content, pinpointing potential contacts for networking and collaborations.
✔️ Career Opportunities — Insights on content popularity show which skills or experiences to emphasize to attract employers.
✔️ Engagement Improvement — Data helps you learn how to craft more compelling posts, boosting your visibility and influence on LinkedIn.
✔️ Content Impact — Monitoring content reach and impact assess the success of your thought leadership, crucial for professional development and recognition.
Benefits For Company Pages
🎯 Improved Content Strategy — Engagement metrics help refine content to boost interaction and expand reach.
🎯 Target Audience Insights — Metrics provide detailed demographic data, enabling tailored marketing to specific job functions and industries.
🎯 ROI Measurement — Performance indicators allow companies to assess campaign effectiveness and optimize spend and strategy.
🎯 Competitor Analysis — Compares performance against competitors to highlight strengths and pinpoint improvement areas.
🎯 Lead Generation Optimization — Analyzing how users engage with content aids in developing strategies to convert engagement into actionable leads.
LinkedIn Analytics for Your Personal Profile
LinkedIn offers analytics for personal profiles, enabling users to track metrics for both their profile and individual posts.
How to navigate to your individual LinkedIn Analytics?
- Go to your profile.
- Click the “Me” icon at the top of your LinkedIn homepage.
- Select “View Profile” from the dropdown menu.
- Find the Analytics Section.
Here is what to look for:
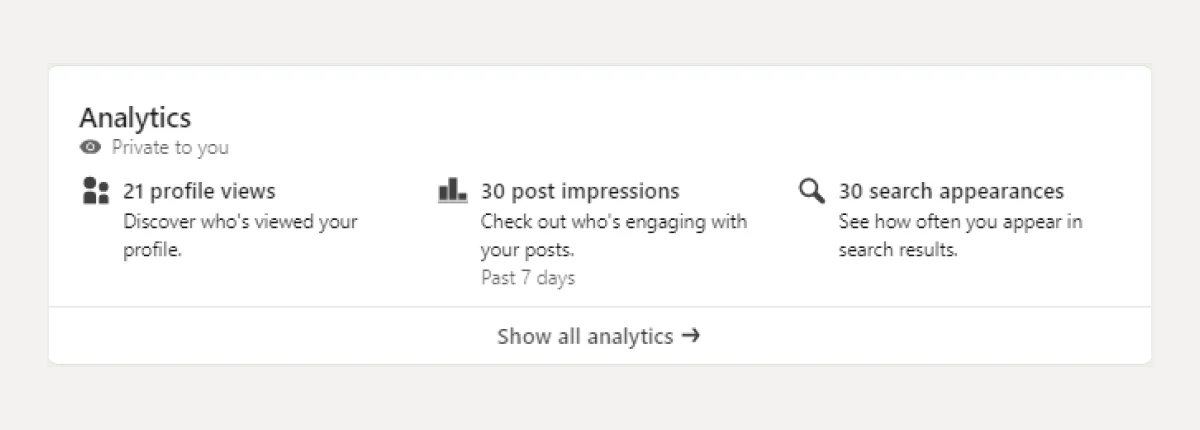
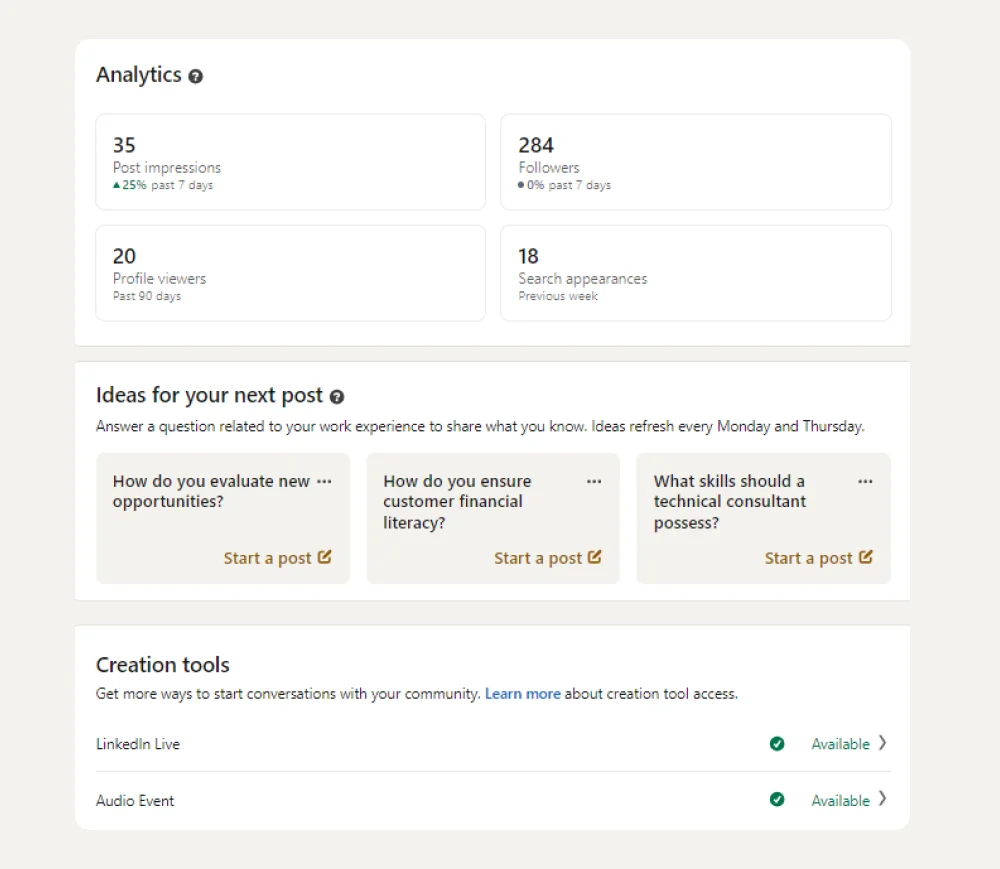
Once you click on "Show all analytics," you'll be taken to the more extensive version of your LinkedIn personal profile analytics dashboard.
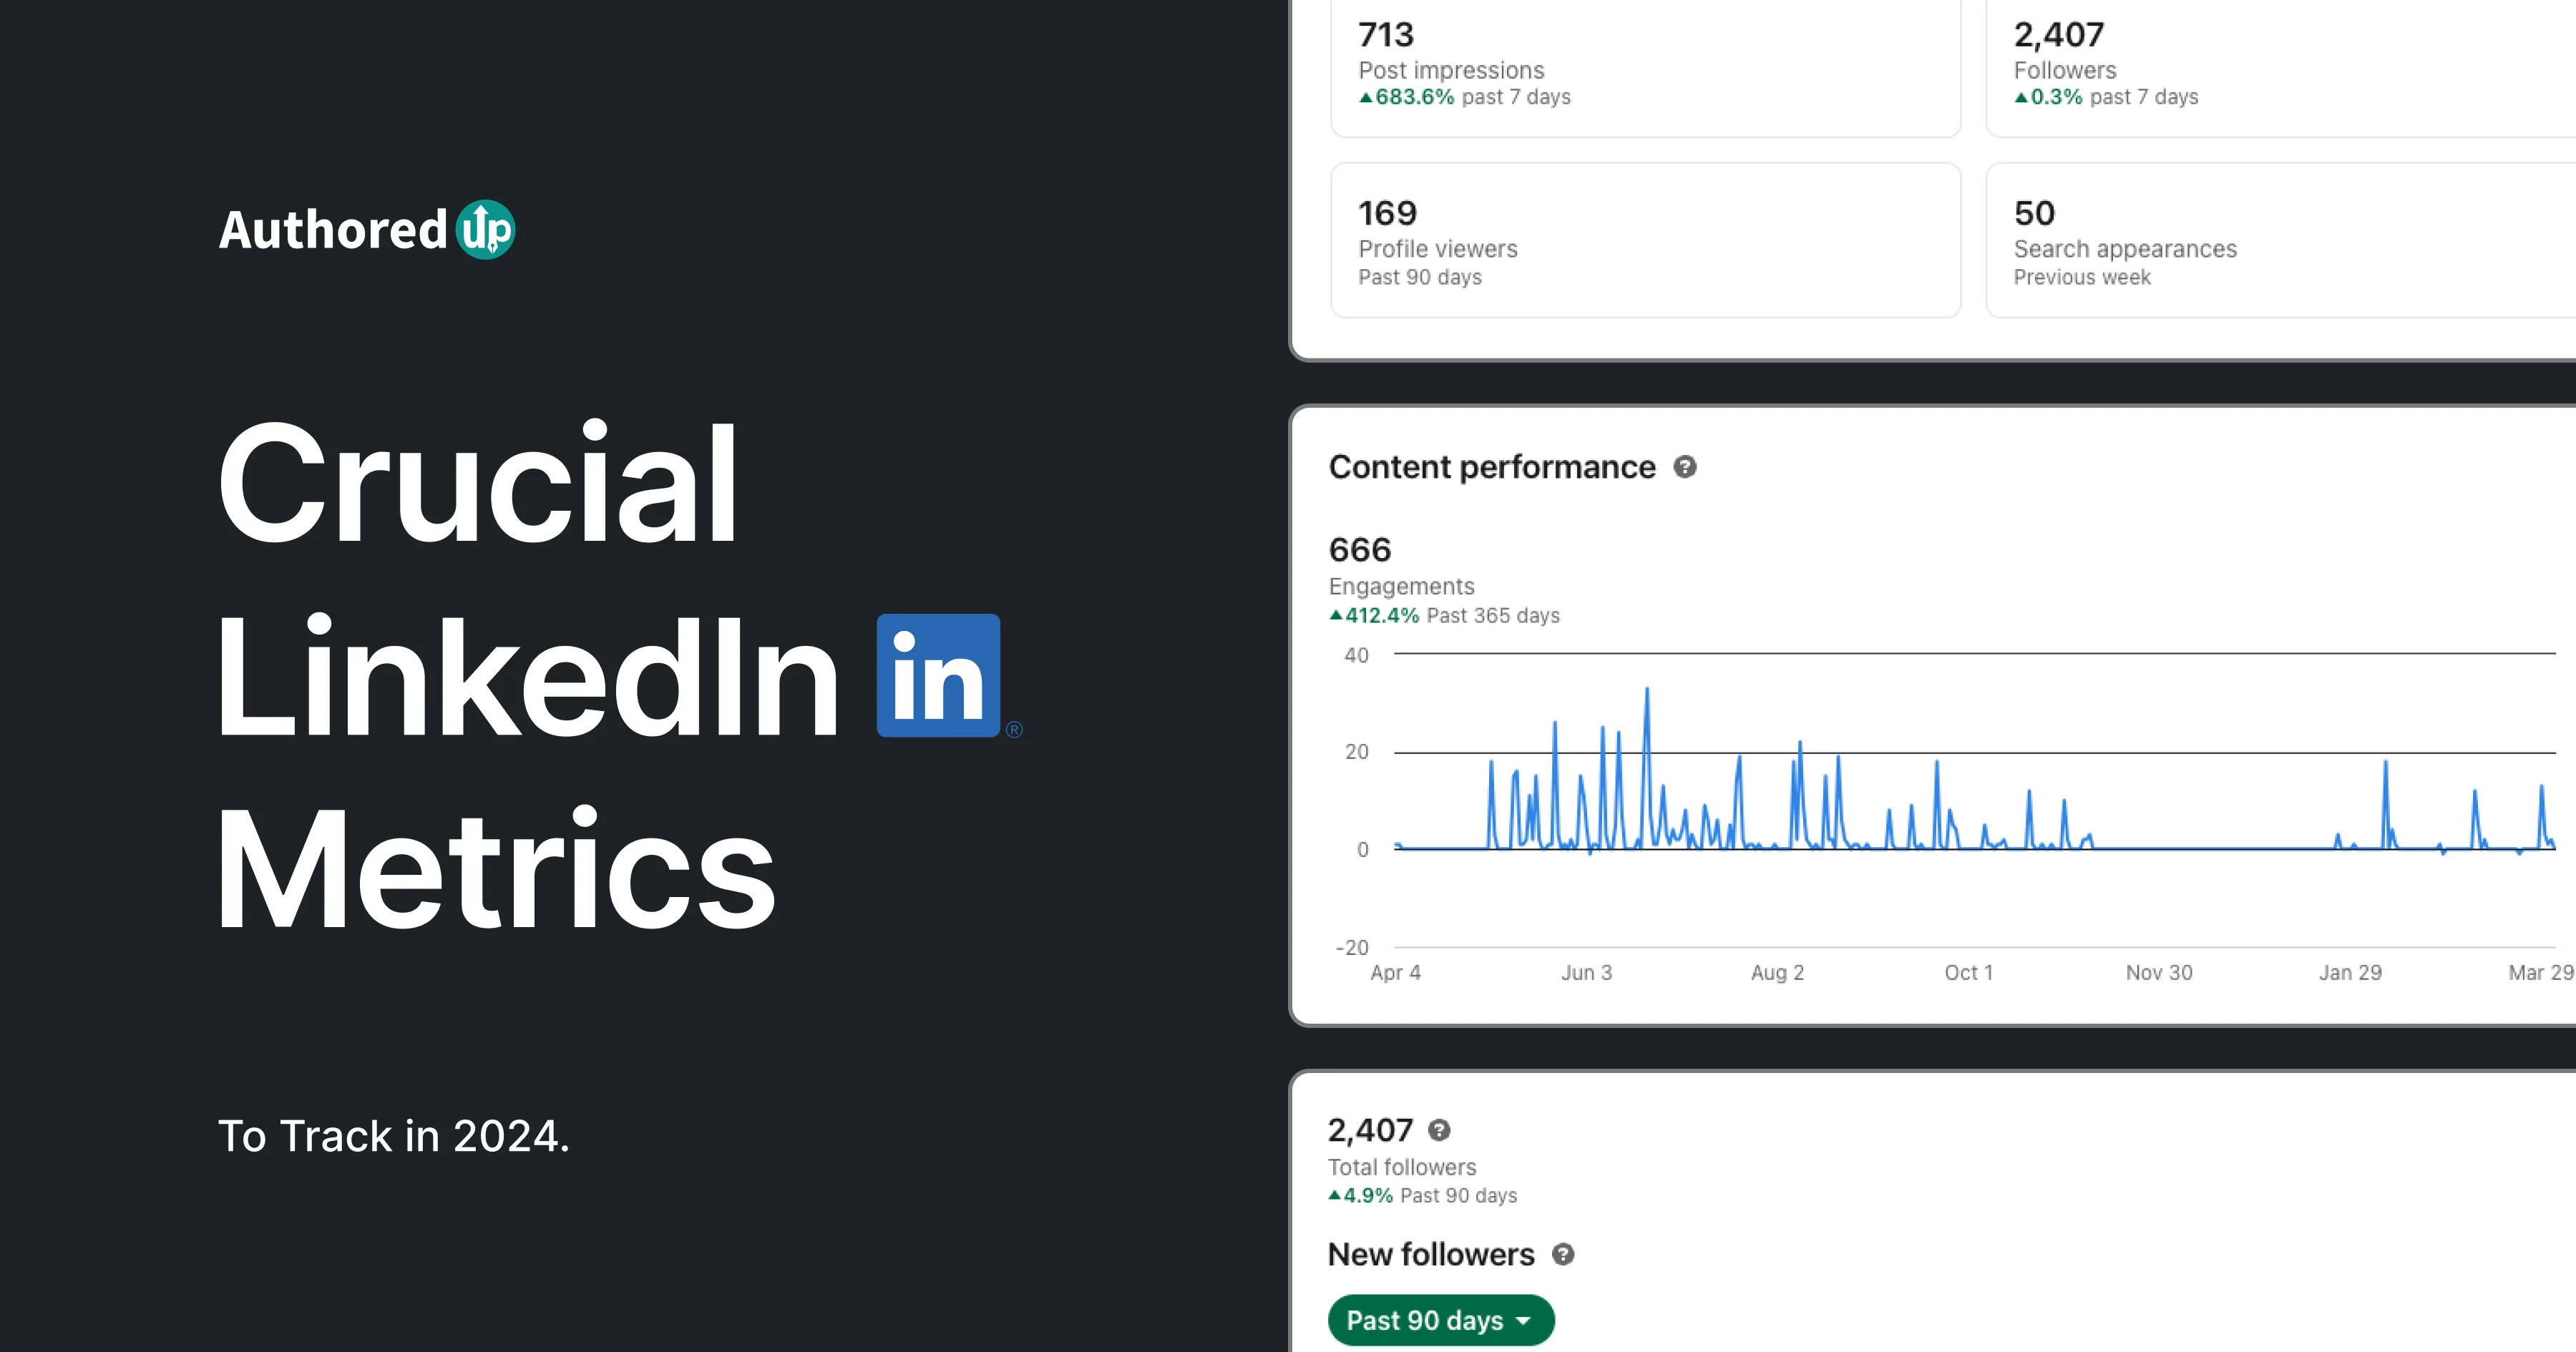
Here, you can see basic data including:
👉 Post Impressions — Total impressions across all your posts.
👉 Followers — Total number of followers and percentage of new followers in the past 7 days.
👉 Profile Viewers — Number of times your profile was viewed in the last 90 days.
👉 Search Appearances — How often your profile appeared in search results over the past seven days.
You’ll also get ideas for your next post and suggestions for LinkedIn creation tools like LinkedIn Live and Audio Event.
If you're looking to dive deeper into LinkedIn data, you can click on each available option for more detailed insights. Here's a breakdown of what you can explore:
1. LinkedIn Post Impressions
When you select "Post Impressions" in LinkedIn Analytics, you access a crucial metric: the number of views your posts, updates, or profile have received on the platform.
Impressions are vital for gauging the reach and visibility of your content among LinkedIn users.
Here, you can preview two key pieces of information:
- Content Performance — Shows how users interact with your posts.
- Top Performing Posts — Identifies which posts have performed best in a given timeframe.
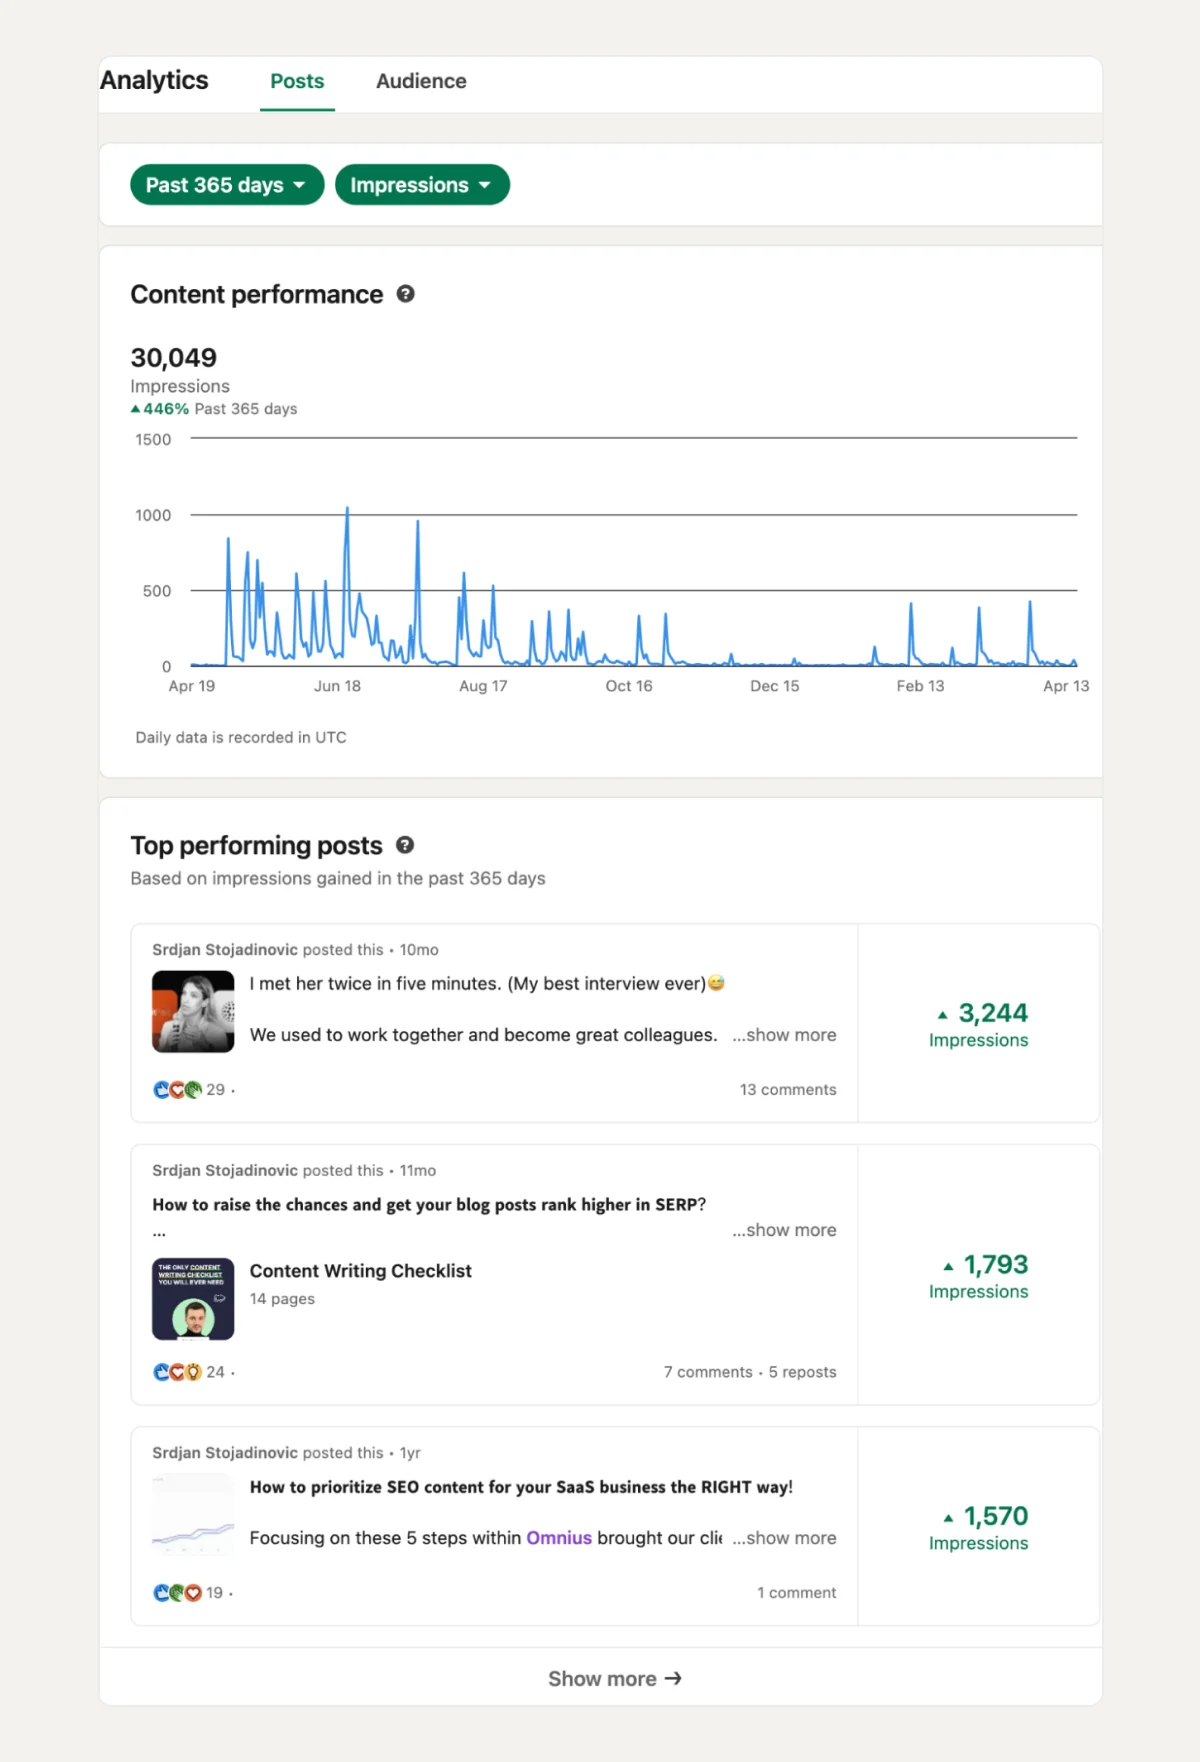
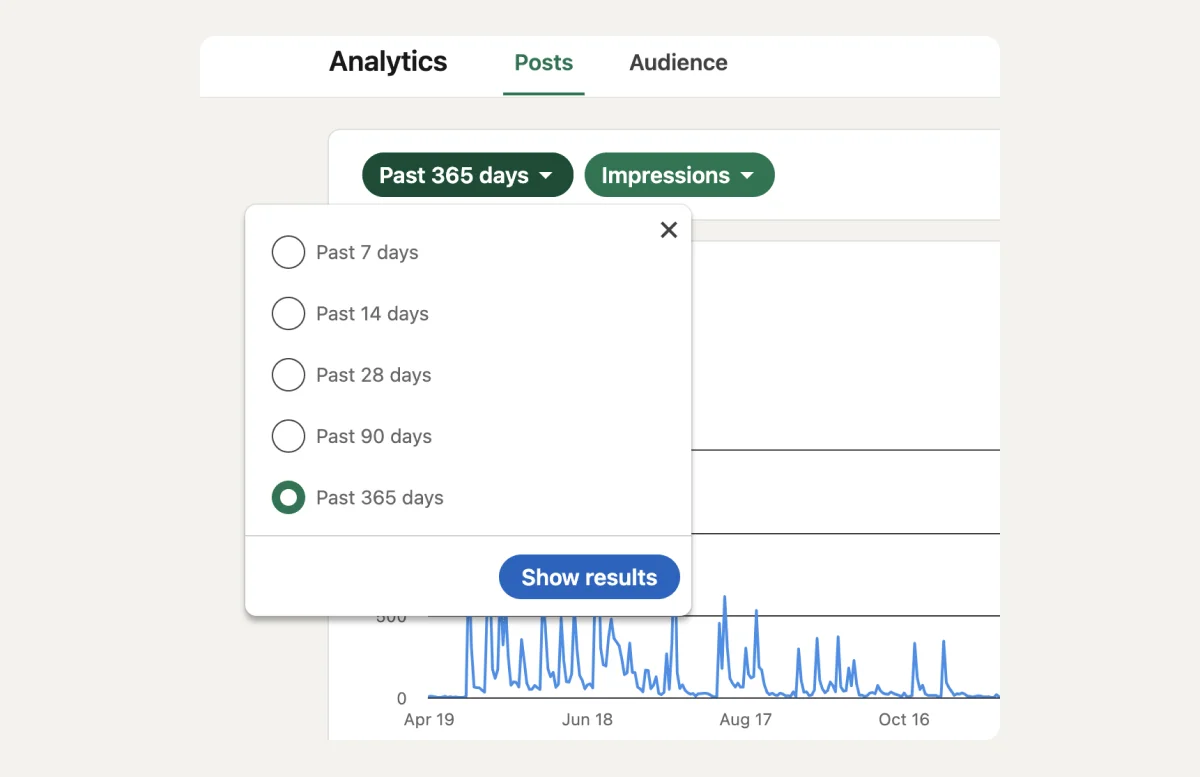
LinkedIn lets you analyze your post performance through impressions across different periods—7, 14, 28, 90, or 365 days—complete with graphical representations of the data.
This feature is essential for monitoring how effectively your content grabs and holds attention over time.
What do these numbers reveal?
👉 High impressions suggest your content is reaching a wide audience, crucial for enhancing brand visibility and establishing your authority.
👉 Conversely, low impressions might indicate the need to adjust your content strategy or posting schedule to better meet your audience's needs.
2. LinkedIn Post Engagement
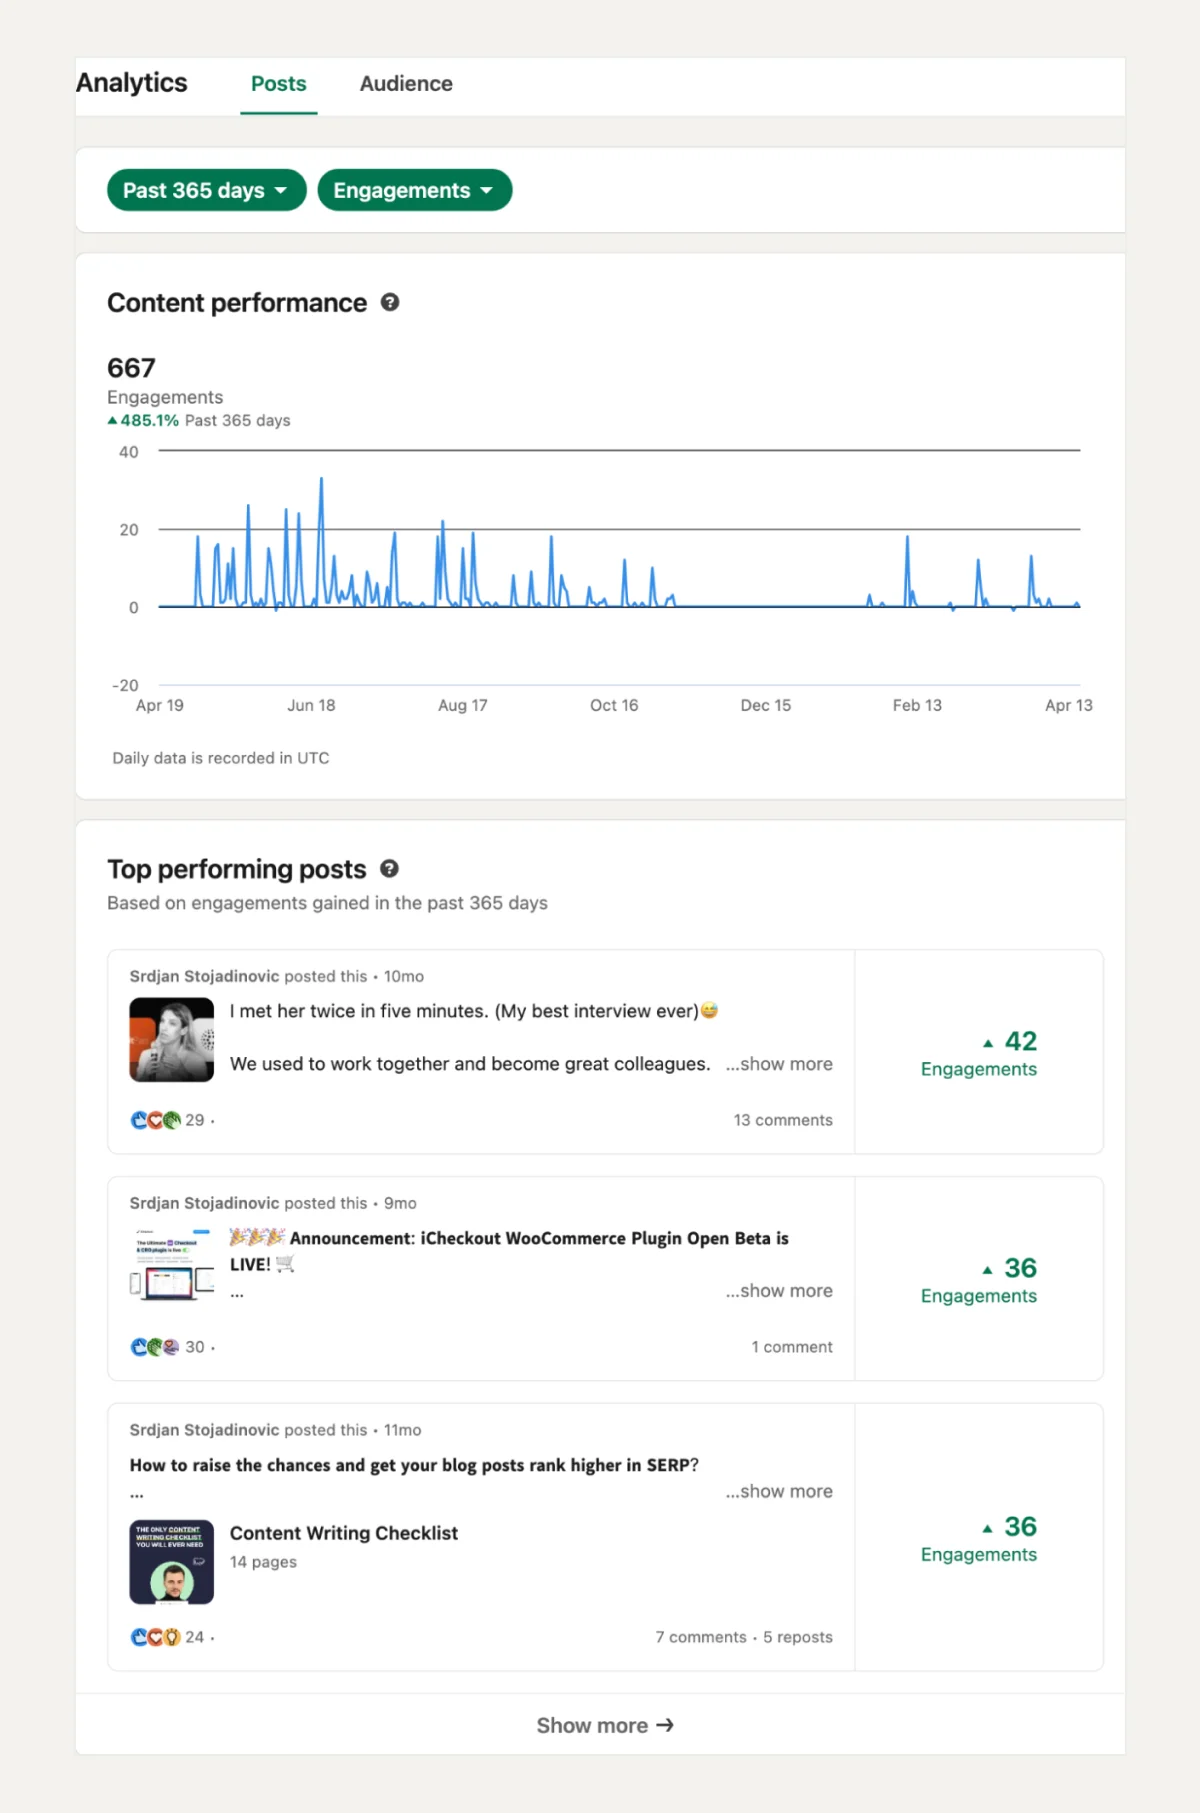
In addition to tracking impressions, measuring engagements on your LinkedIn posts is essential to find out how much your audience interacts with and appreciates your content. Engagements encompass likes, comments, shares, and other forms of direct interaction with your posts.
When using LinkedIn Analytics to monitor engagements, you will find:
- Engagement Rate for a Selected Period — This number is calculated by dividing the total number of interactions by the number of impressions. This metric helps you assess how engaging your content is to those who see it.
- Top Performing Posts by Engagement for a Selected Period — This report identifies which of your posts have generated the most interaction, providing insights into the topics or styles that most appeal to your audience.
Why track engagements?
Engagements offer a deeper insight than impressions, as they show who sees your content and who finds it engaging enough to interact with.
A high engagement rate typically indicates that your content strongly resonates with your audience, encouraging them to:
👉 share their thoughts,
👉 spread your posts within their networks or
👉 show their support through likes.
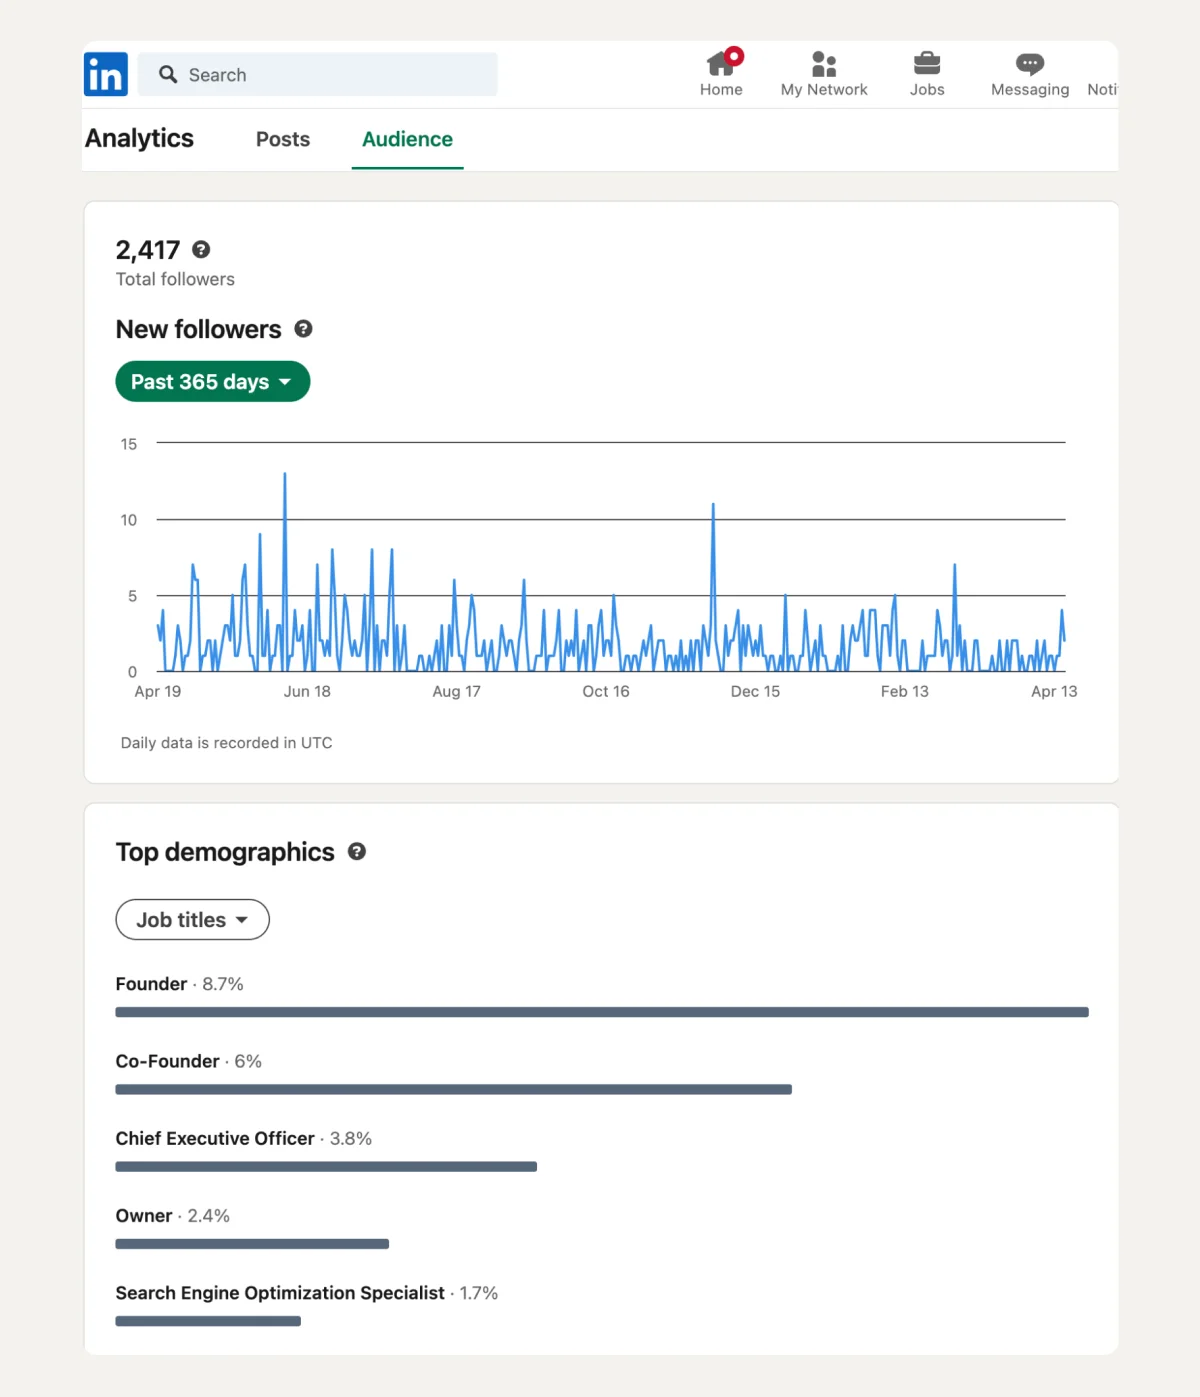
3. LinkedIn Audience Metrics
When exploring the "Audience" option in LinkedIn Analytics, you gain insights into your audience's makeup and growth, which is crucial for tailoring your content and engagement strategies.
Here, you can find the following metrics:
- New Followers – This metric shows the number of users who have started following you during a specified time period, helping you track the growth and appeal of your profile or page.
- Top Demographics – Provides a breakdown of your audience's key characteristics such as job function, industry, and seniority, enabling you to understand who your content resonates with the most.
Why track audience metrics on LinkedIn?
Tracking audience metrics on LinkedIn is essential because it helps you understand who your content is reaching and engaging.
👉 Knowing your audience's demographics and growth trends can help you optimize your content strategy and posting schedule and strengthen your overall LinkedIn presence.
👉 This targeted approach can lead to more meaningful interactions and stronger professional relationships.
📌 Bonus Tip: Utilize LinkedIn Creator Mode Analytics to Enhance Your Reach
Creator mode is a LinkedIn feature designed to boost your visibility and influence on the platform. Here is how:
- It changes the "Connect" button to a "Follow" button,
- highlights the "Featured" and "Activity" sections of your profile, and
- provides additional tools for creating and showcasing content.
How to enable creator mode?
- Click the “Me” icon on your LinkedIn homepage.
- Select “View Profile” and scroll to “Resources”.
- Find the “Creator mode” and click Off to open the settings box.
- Click Next in the popup box and follow the on-screen instructions to turn on Creator mode.
Once activated, Creator mode provides specialized analytics that help you measure the impact of your content and better understand your audience's engagement and growth.
LinkedIn Analytics For a Company Page
LinkedIn Analytics is also available for your Company Page, providing insights into visitor demographics, content engagement, and more.
However, starting in November 2023, LinkedIn implemented privacy enhancements that may impact how frequently visitor demographic data is updated.
To comply with privacy standards, the platform requires a minimum number of unique visitors before displaying these results.
How to access Analytics on your LinkedIn Company Page?
- Sign into your LinkedIn account and navigate to your Company Page.
- Click on the "Analytics" tab at the top of your page to open the analytics dashboard.
- You can choose the specific analytics you want to view from the menu—visitors, followers, leads, content, competitors, or employee advocacy.
In the following sections, we'll explore each of these metrics in more detail, exploring what they reveal about your page's performance and how you can use this information to enhance your LinkedIn strategy.
1. Visitors Analytics
As a LinkedIn Page admin, having access to LinkedIn’s Visitor Analytics is crucial.
This feature provides you with a detailed look at your page's performance by tracking traffic and analyzing demographic trends across different time periods.
Utilizing this data is key to refining your content strategy and optimizing your page, helping you convert more visitors into followers effectively.
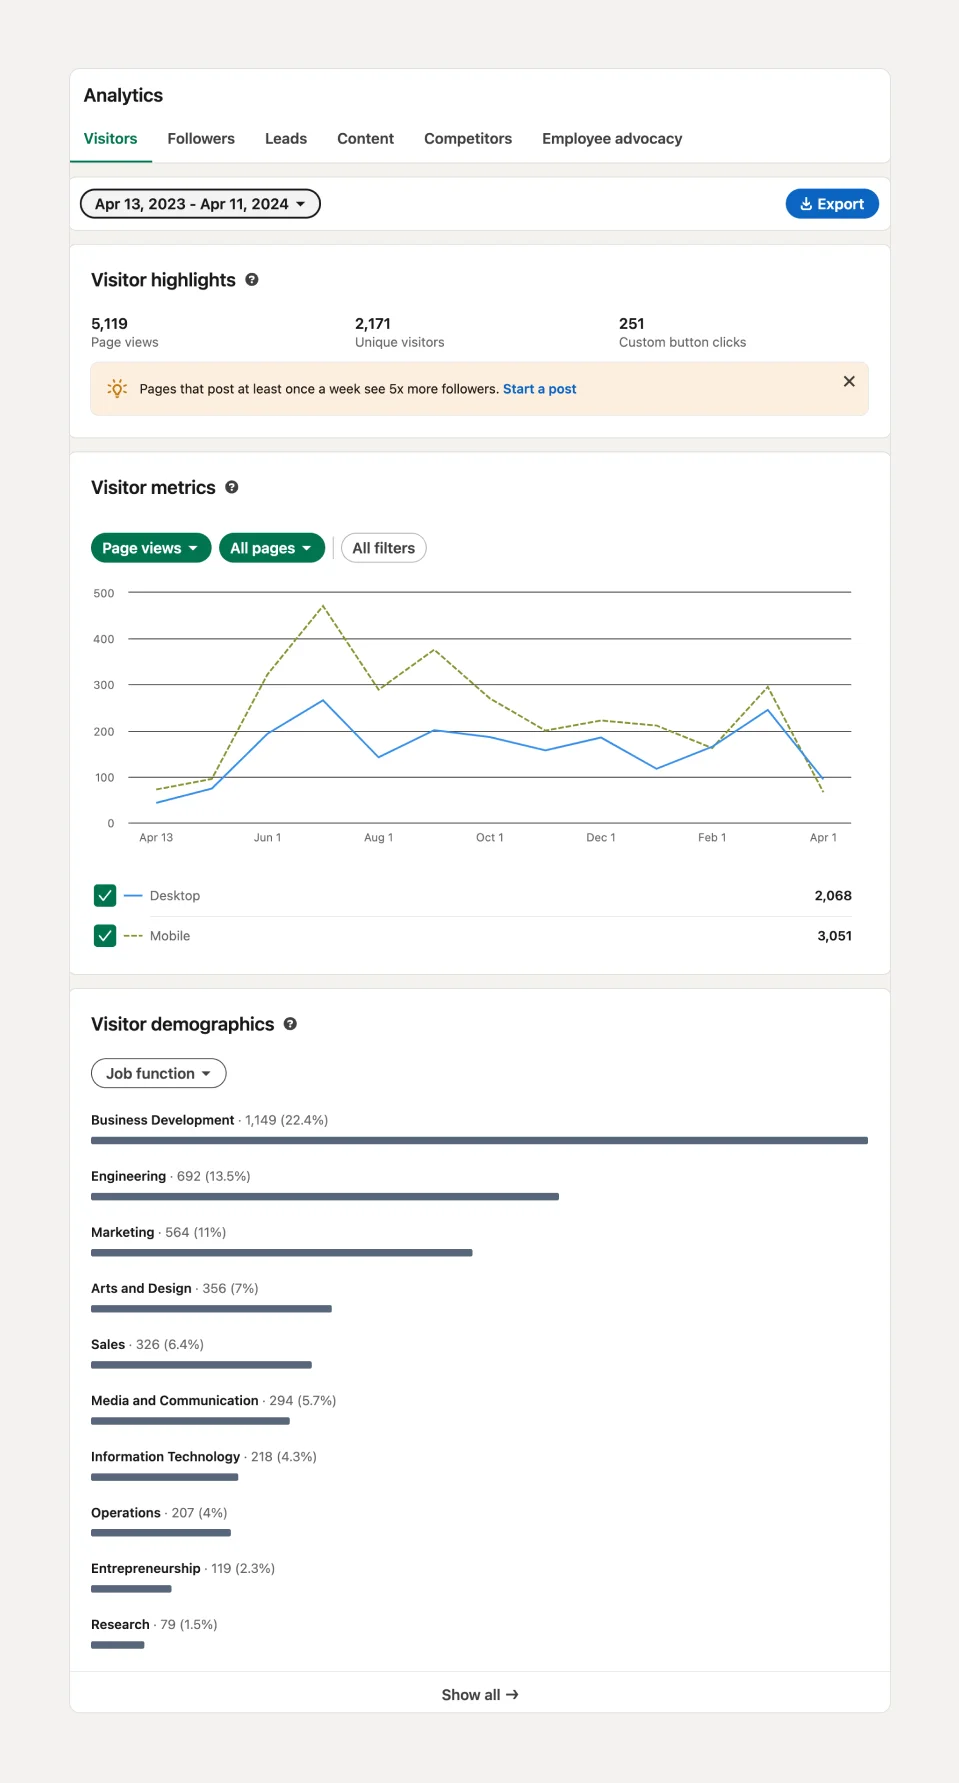
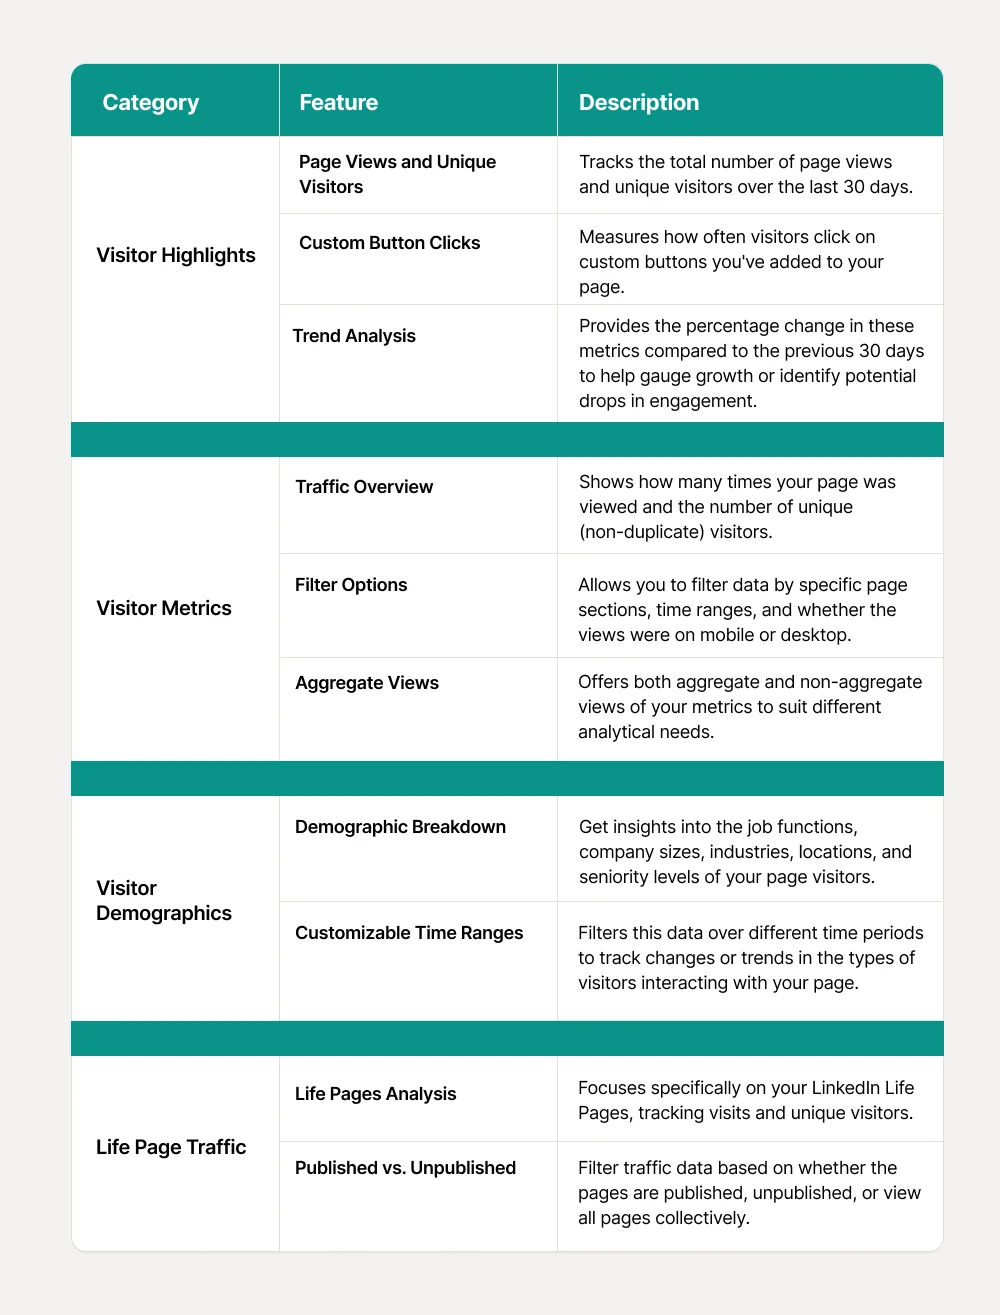
Here are some key features of Visitor Analytics:
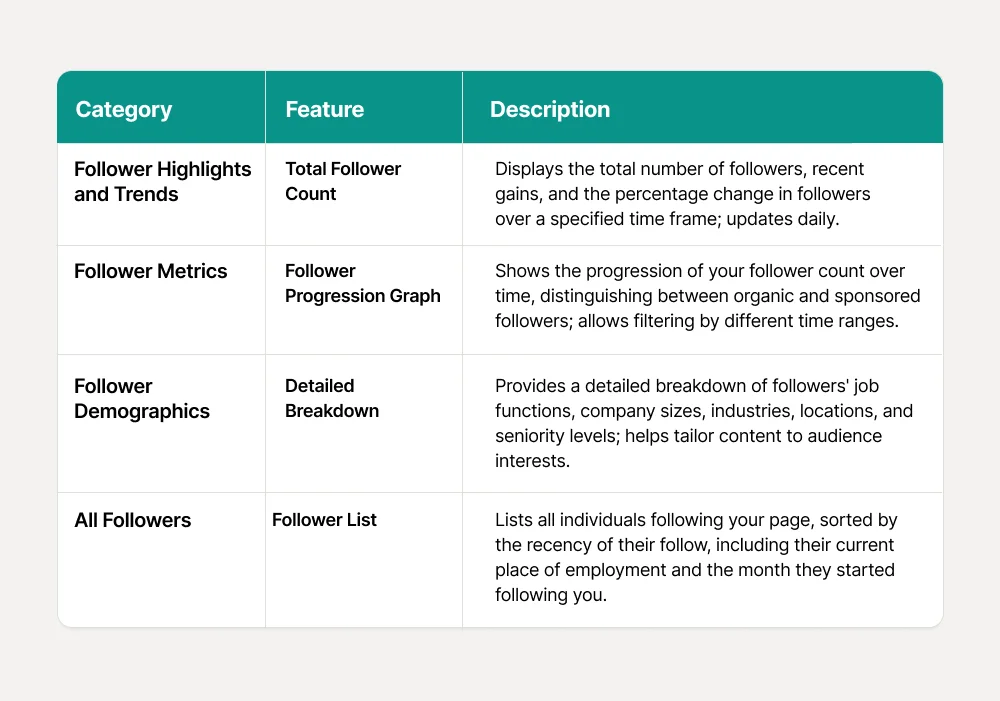
2. Follower Analytics
LinkedIn's Followers Analytics provides valuable insights into your audience, enabling you to tailor your content strategy effectively.
This feature gives you a clear view of who is following your page, their professional backgrounds, and how their engagement changes over time.
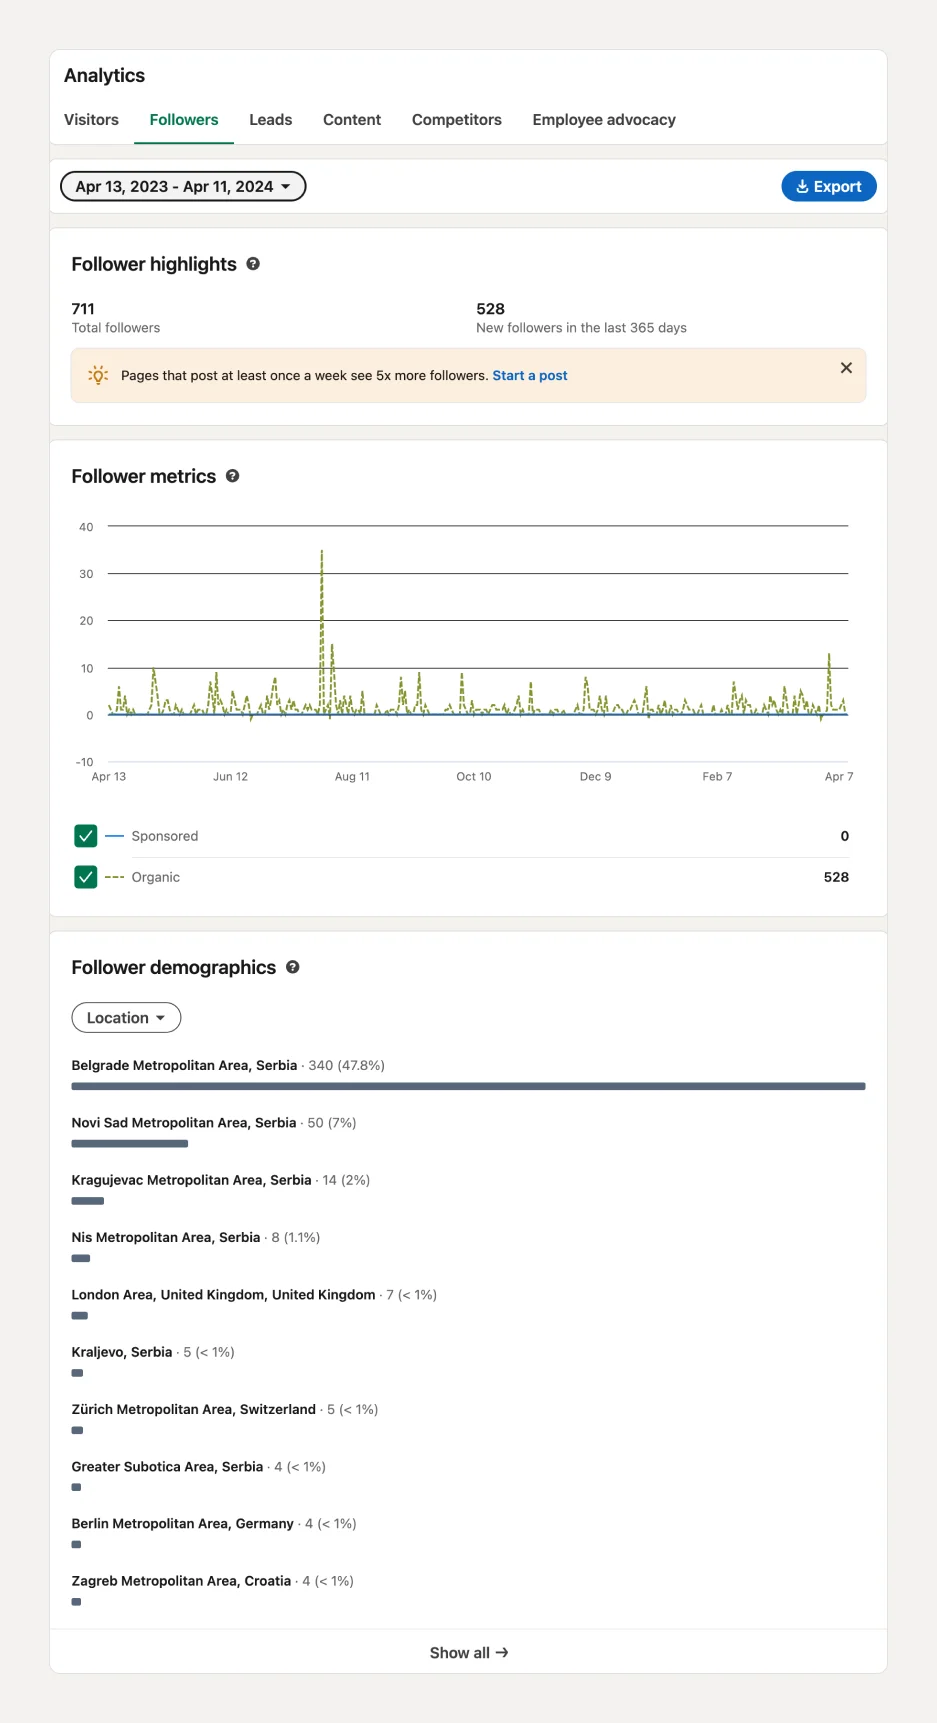
Below is a table that summarizes the key aspects of LinkedIn's Follower Analytics:
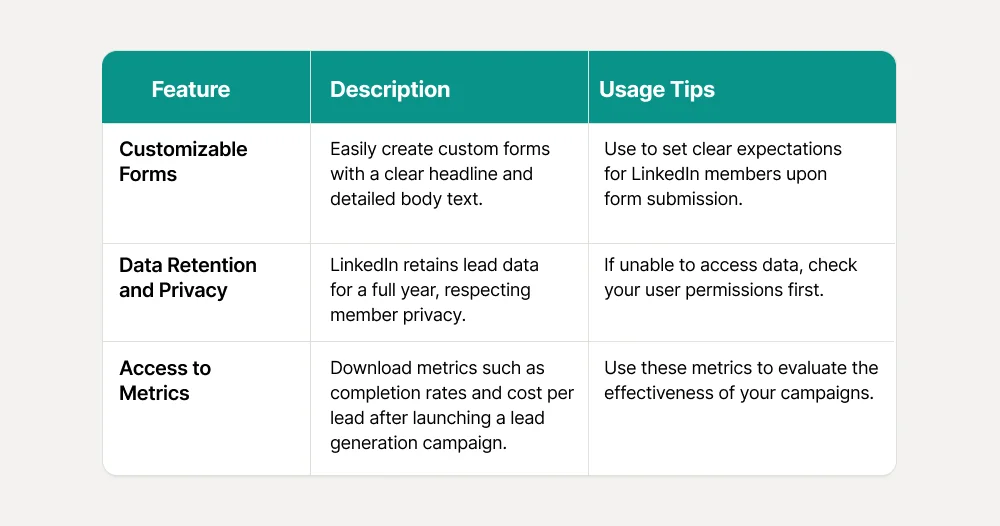
3. Leads Analytics
Lead Analytics on LinkedIn equips page administrators with a robust tool to amplify their lead collection initiatives.
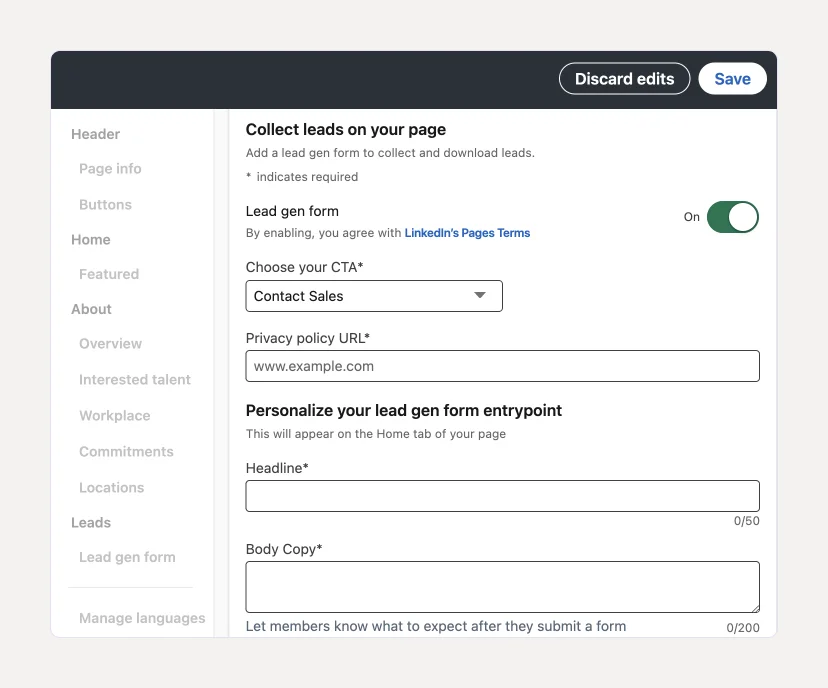
With this feature, you can seamlessly gather leads via custom forms embedded directly on your page.
Tailoring these forms is straightforward: craft a headline and detailed body copy to set clear expectations for members upon form submission.
Here are the key features of the Lead Generation metric and how to use them:
Requirements for Accessing Lead Analytics on LinkedIn
To access and download lead data, you must have at least Viewer access on the ad account and hold specific page roles such as Page Admin or Lead Gen Forms Manager.
Activating Lead Metrics
1. Navigate to Analytics — Go to your LinkedIn page's analytics section.
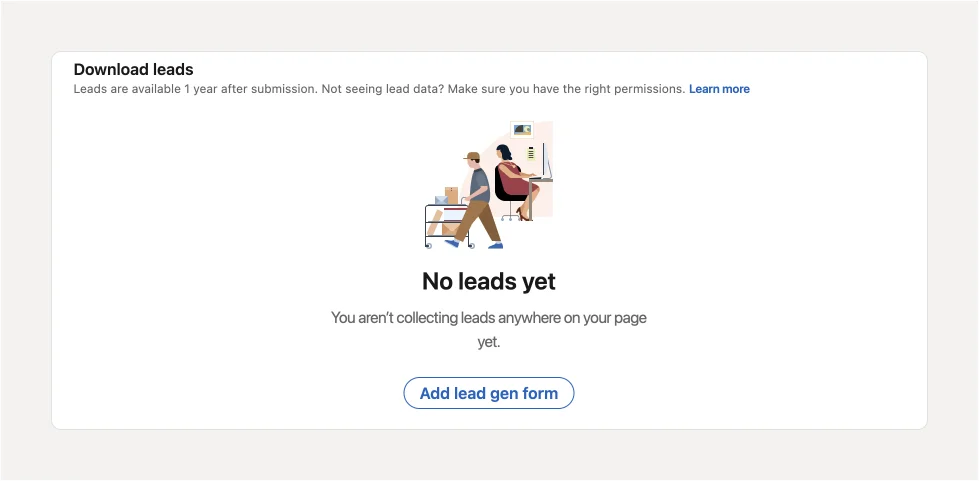
2. Enable Lead Gen Forms — Click on the 'Leads' tab and activate the 'Lead Gen form' feature.
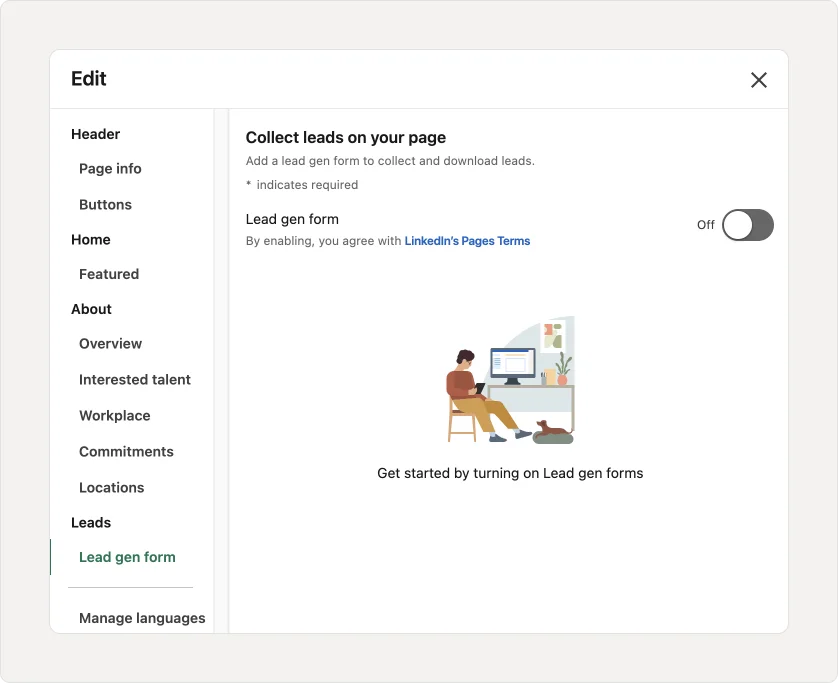
3. Set Up Your Form — Choose a compelling call-to-action (CTA) for your campaign, link to your privacy policy, and write engaging content for your form to attract and inform potential leads.
4. Launch and Monitor — Once your form is live, LinkedIn begins collecting leads based on member interactions. Monitor these interactions and gather lead data directly from the analytics dashboard.
Additional Information
👉 Lead data is stored for one year due to privacy policies, but the analytical data from your campaigns remains accessible indefinitely in Campaign Manager.
👉To manage Lead Gen Forms, download leads, or integrate with your CRM, you must be in a LinkedIn Page admin role.
4. Content Analytics
LinkedIn Content Analytics offers page administrators vital insights to gauge and analyze engagement trends across their posts.
This tool is indispensable for evaluating how various types of content perform, refining engagement strategies, and gaining a deeper understanding of audience preferences.
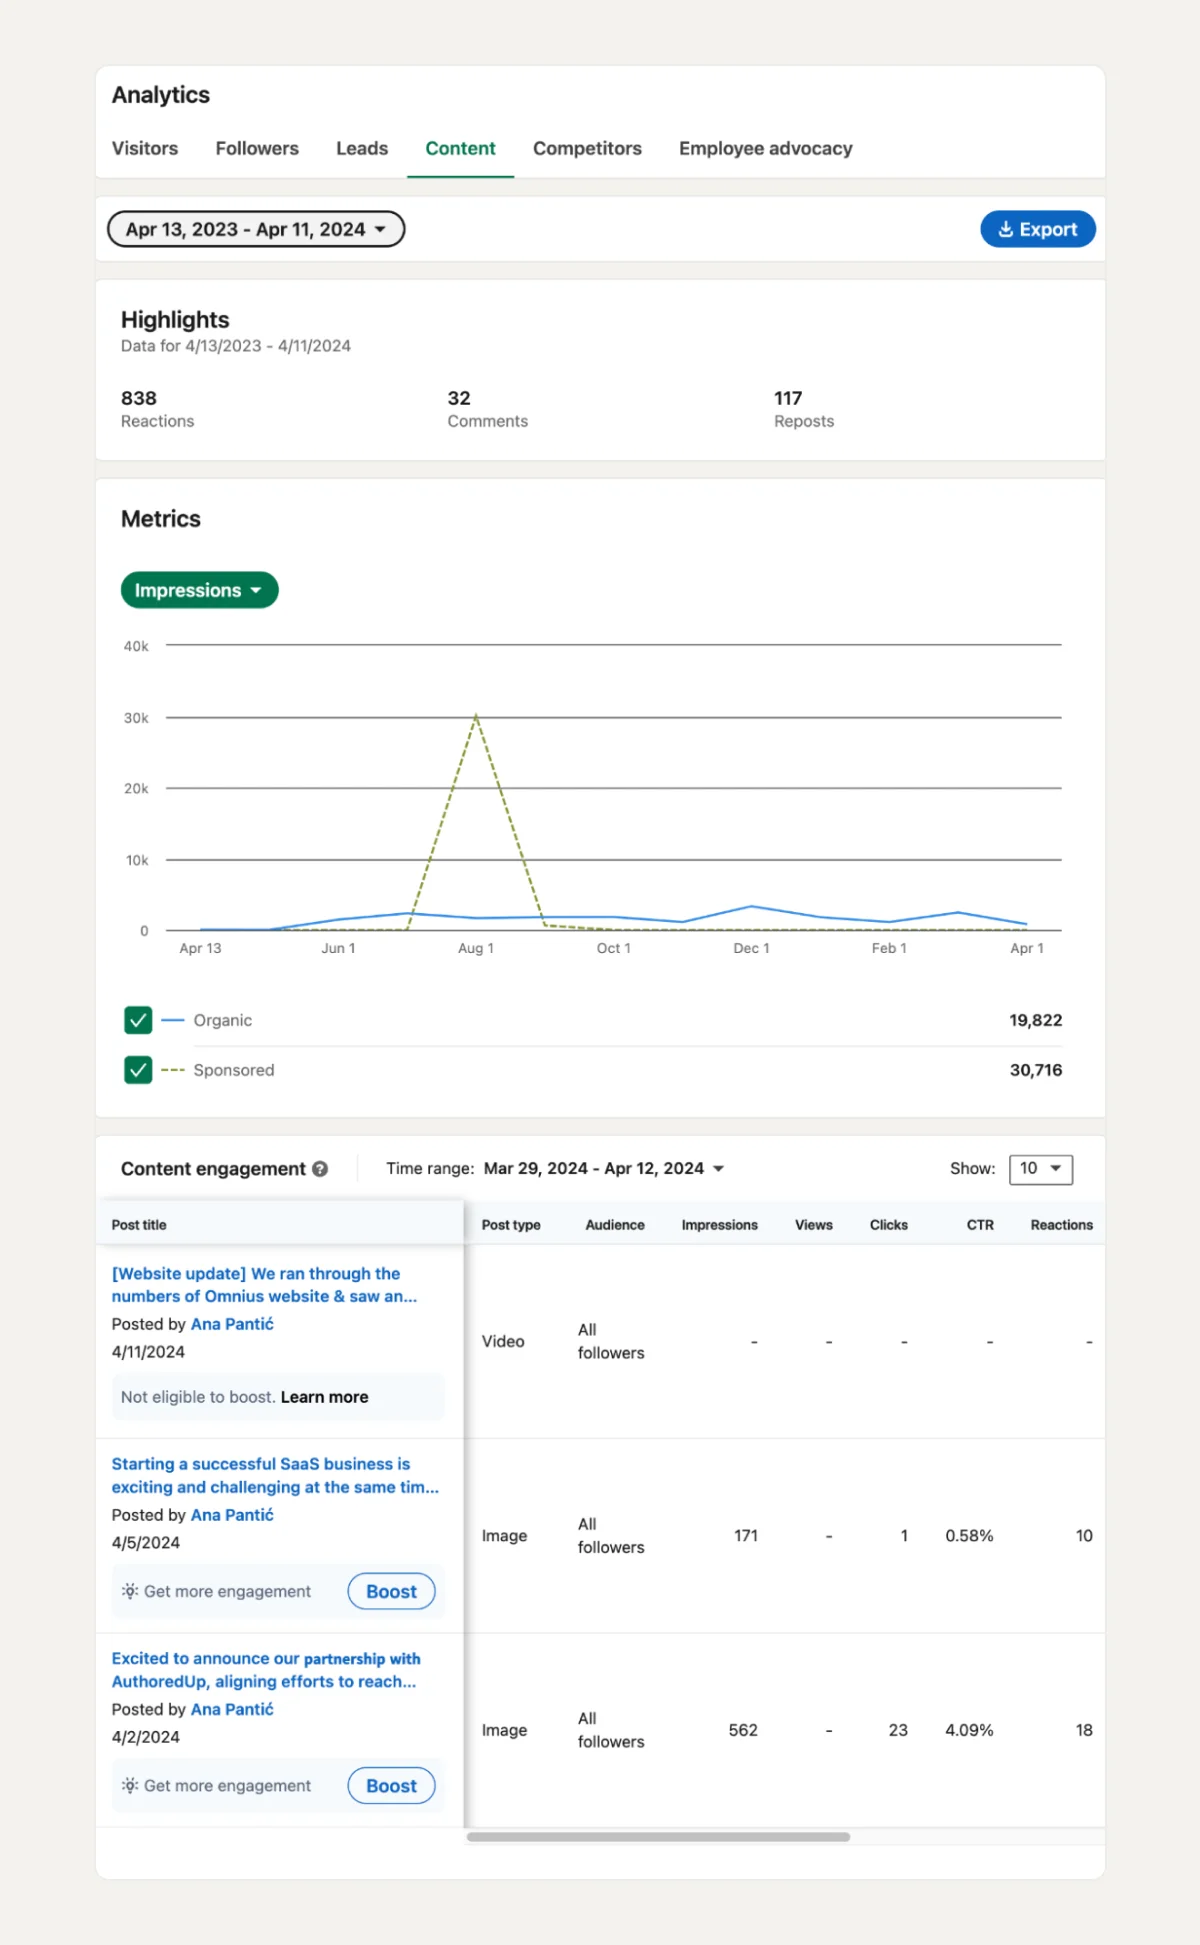
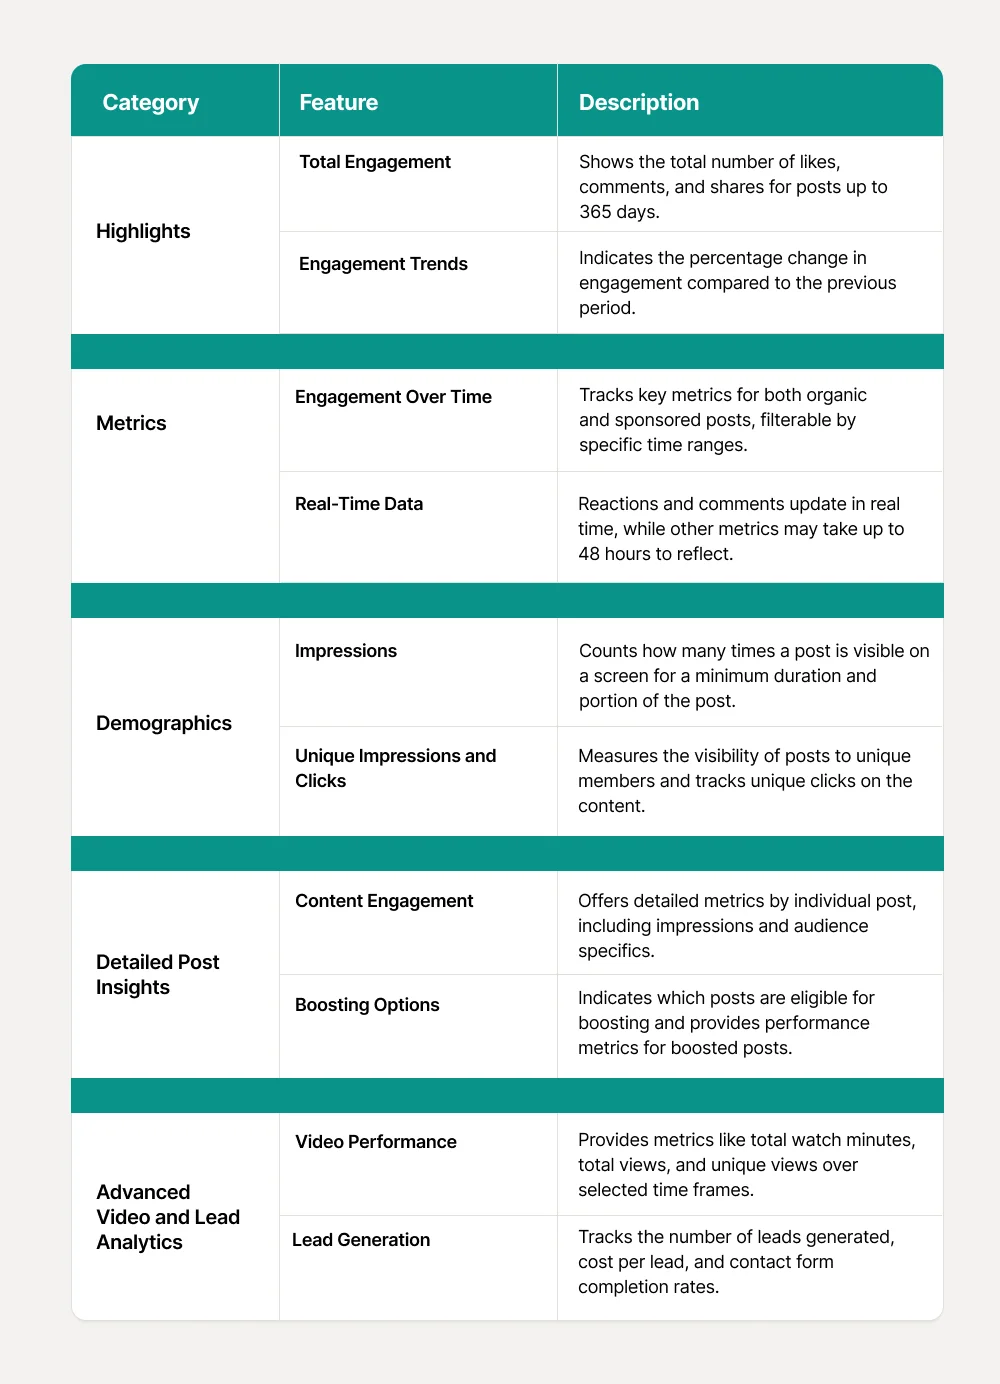
Below is a table that outlines the key features of LinkedIn Content Analytics, covering:
✔️ Highlights
✔️ Metrics
✔️ Demographics
✔️ Detailed Post Insights
✔️ Advanced Analytics for video and lead generation.
Important Considerations for LinkedIn’s Content Analytics
👉 It's essential to understand that analytics for boosted posts on LinkedIn might vary from what is displayed in Campaign Manager.
LinkedIn's Content Analytics specifically includes metrics for boosted posts that appear in the feed, while Campaign Manager also captures offsite views and various other ad formats.
👉Additionally, while demographic data is presented as a percentage of total unique visitors, LinkedIn adheres to strict privacy policies when retaining detailed lead and engagement data, generally storing this information for up to one year.
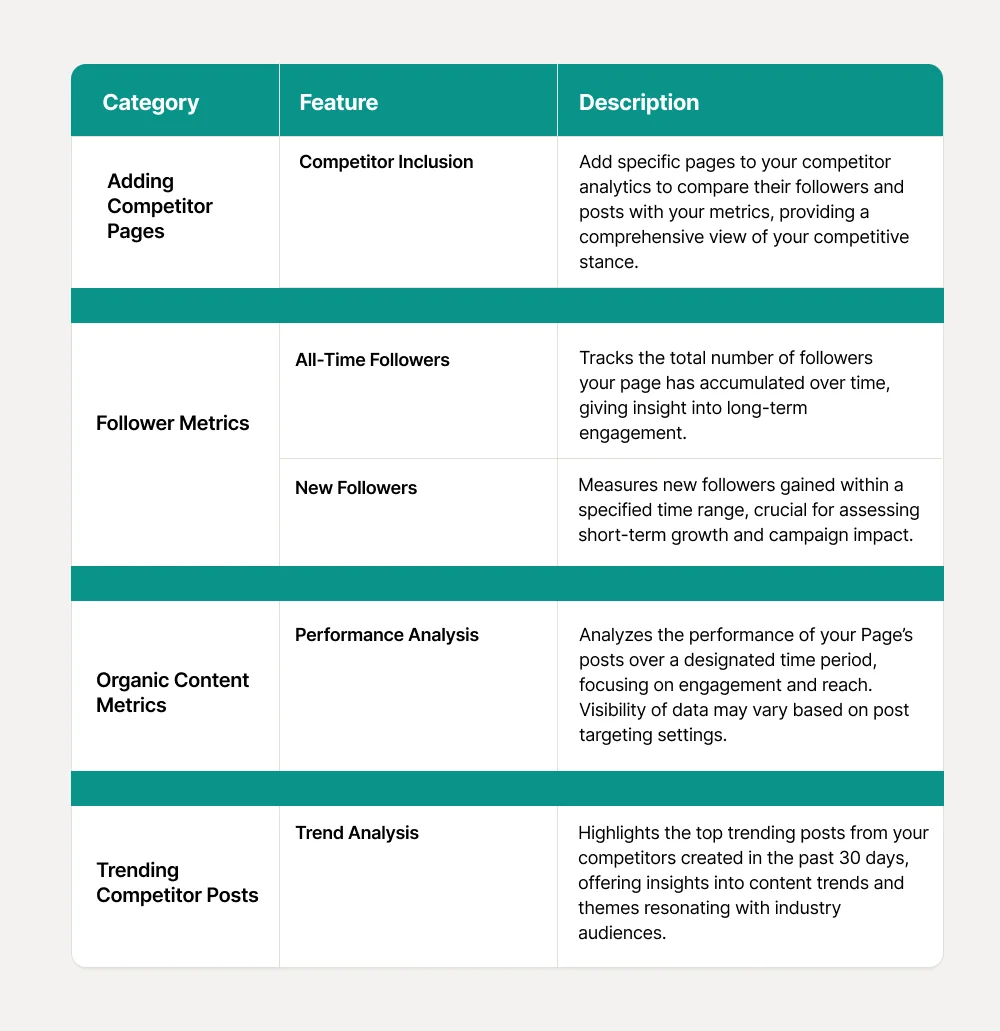
5. Competitors
Competitor analytics on LinkedIn provides Page admins with the tools to benchmark their brand’s performance against competitors by comparing follower growth and engagement on organic content.
This feature is invaluable for understanding your position within your industry and uncovering the content strategies that are working well for your competitors.
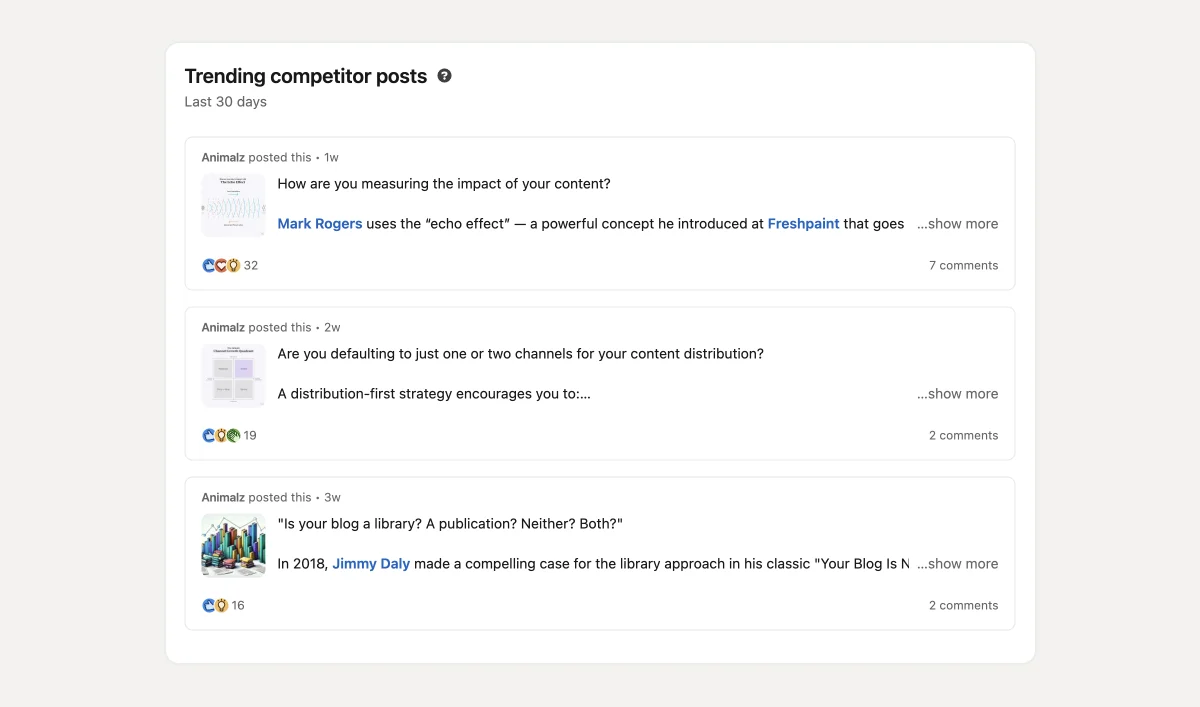
Here is a table that outlines the key features of Competitor Analytics on LinkedIn:
Important Considerations for LinkedIn’s Competitor Analytics
👉 All data and times are reported in Coordinated Universal Time (UTC). This standardization ensures consistency across global markets.
👉 Data is refreshed daily to provide the most up-to-date insights. This frequent updating helps ensure that your strategies remain aligned with current trends and market dynamics.
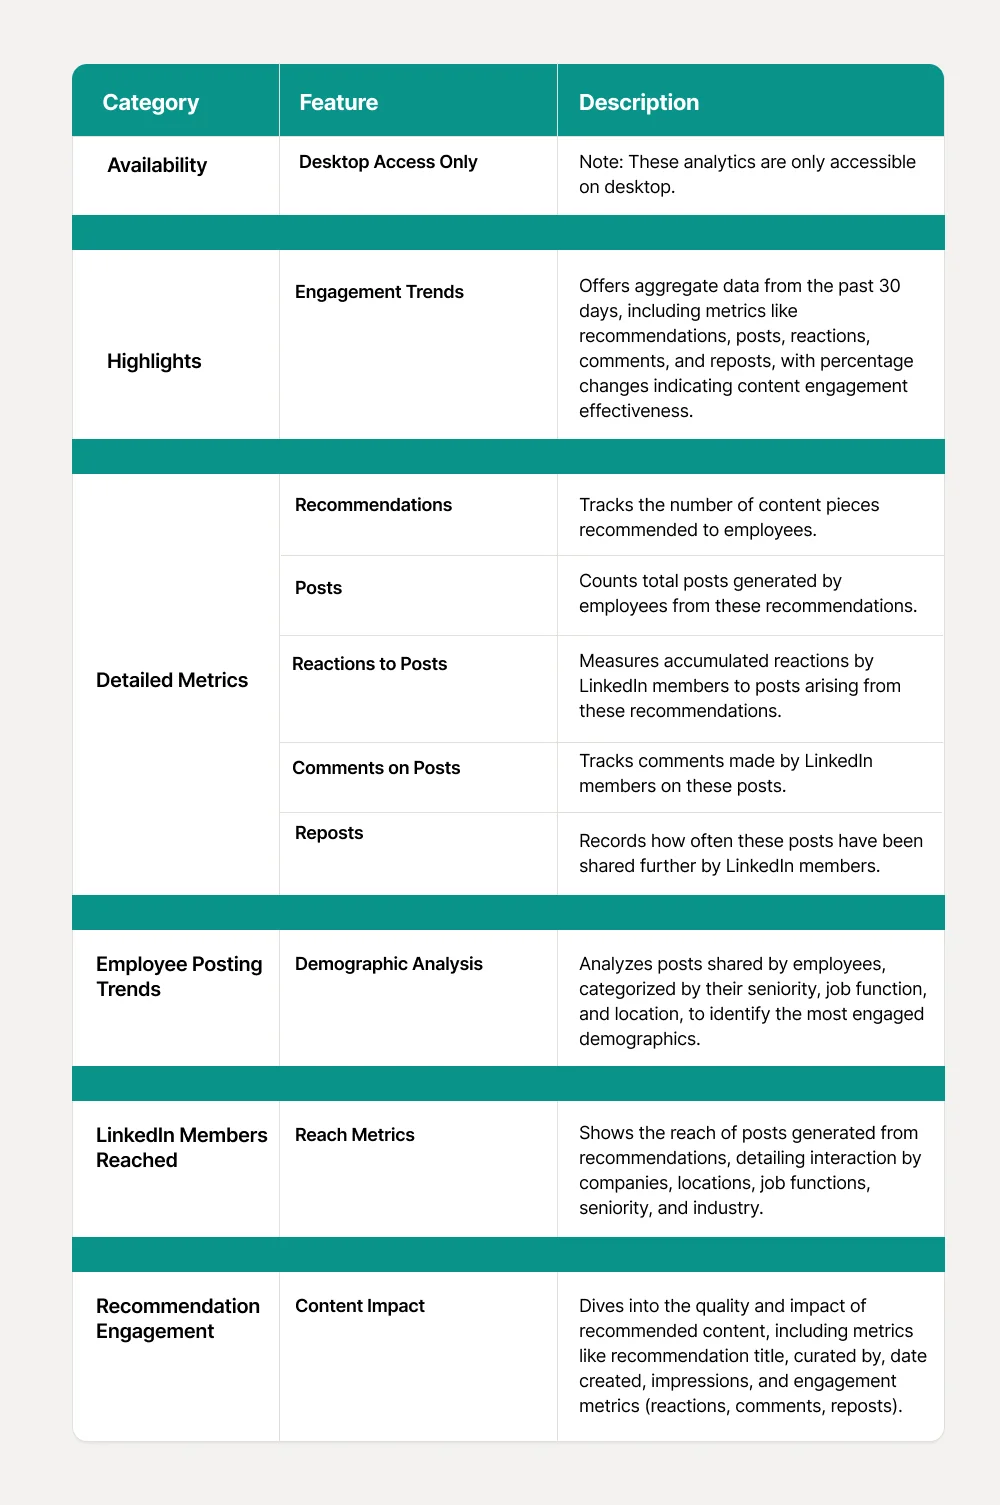
6. Employee Advocacy
Employee Advocacy Analytics on LinkedIn offers Page admins crucial insights into how employees interact with and promote company content.
This feature is essential for monitoring the impact of content recommendations given to employees and assessing how these recommendations foster engagement within the company and with a broader audience.
Here are the key features of Employee Advocacy Analytics on LinkedIn, detailing their functionalities and scope
How to Recommend Posts to Your Employees?
1. Sign in to your LinkedIn account where you have administrative access to your Company Page.
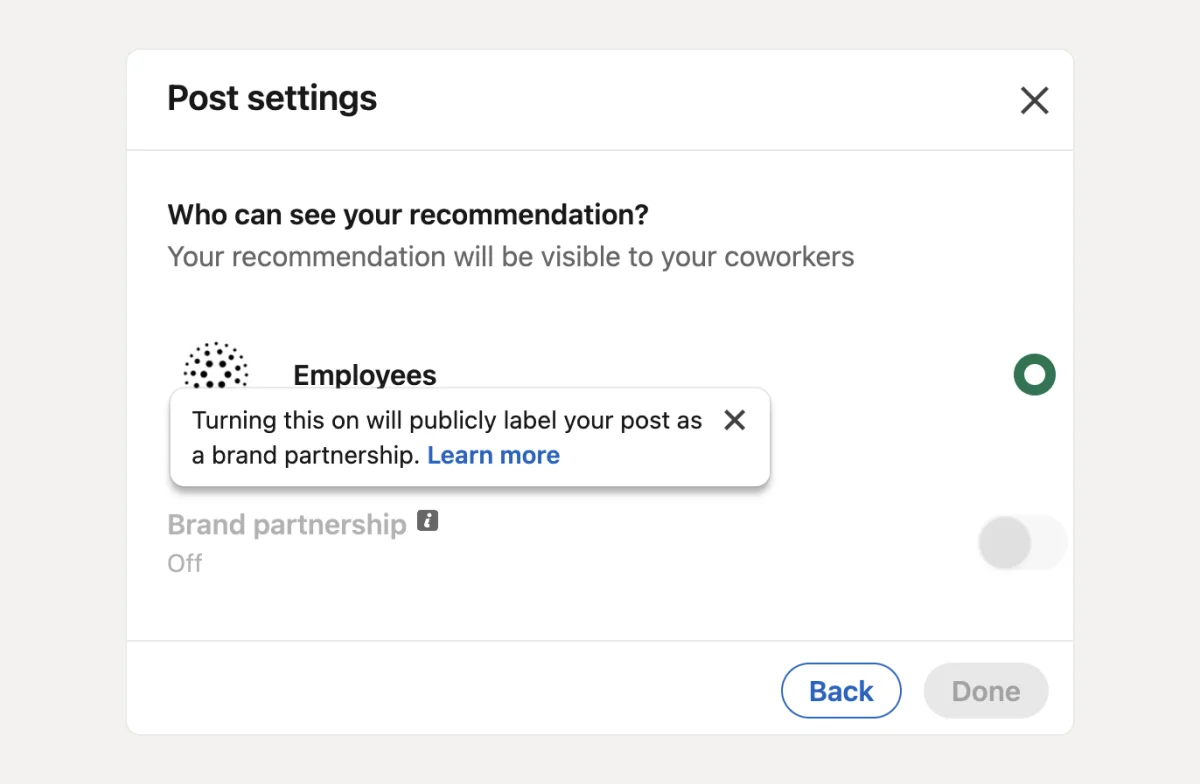
2. Navigate to your Home feed. Alongside the regular "Posts" option, you'll find an additional option titled “Recommend to employees.”
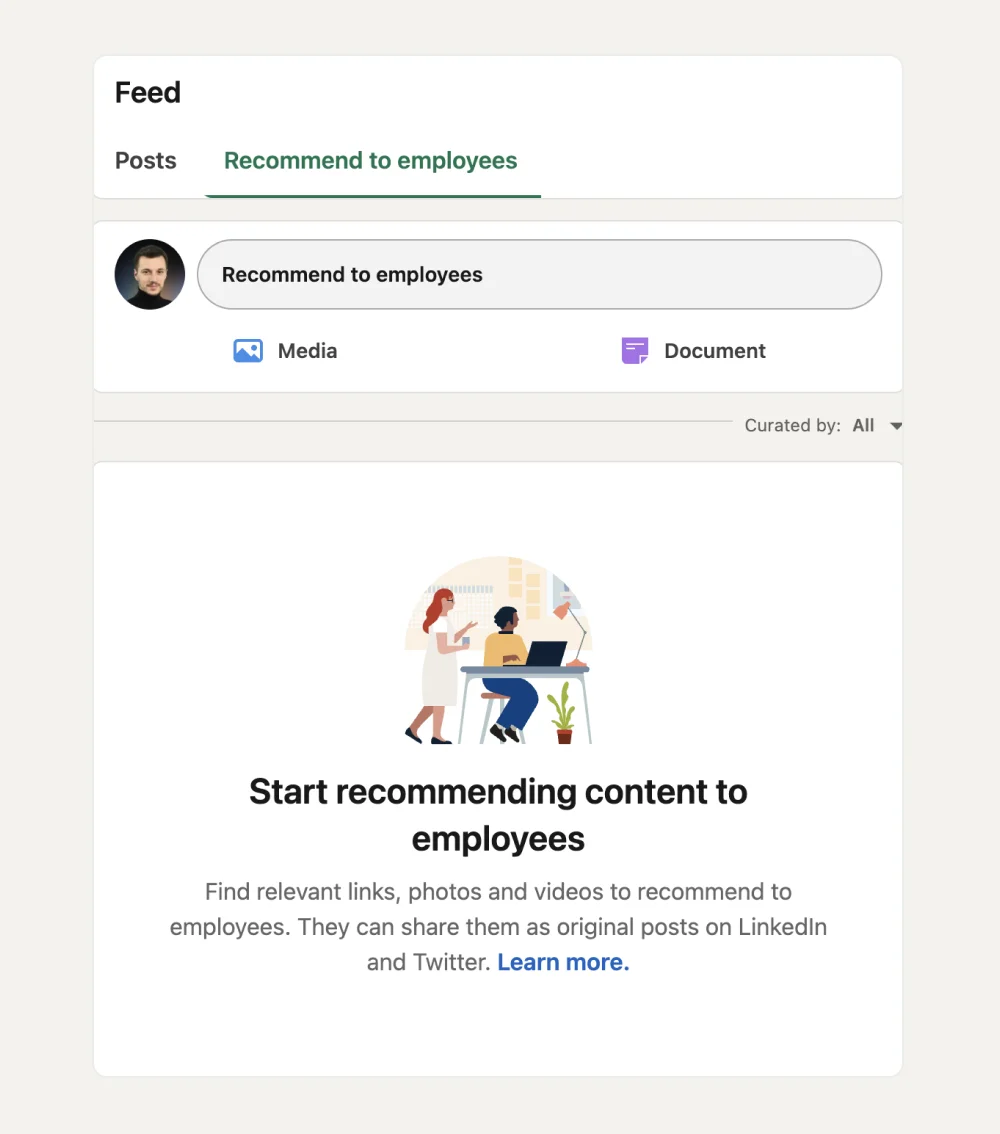
3. You can write a new post or choose to reuse an old one. Once you've prepared your content, click on the "Recommend" button.
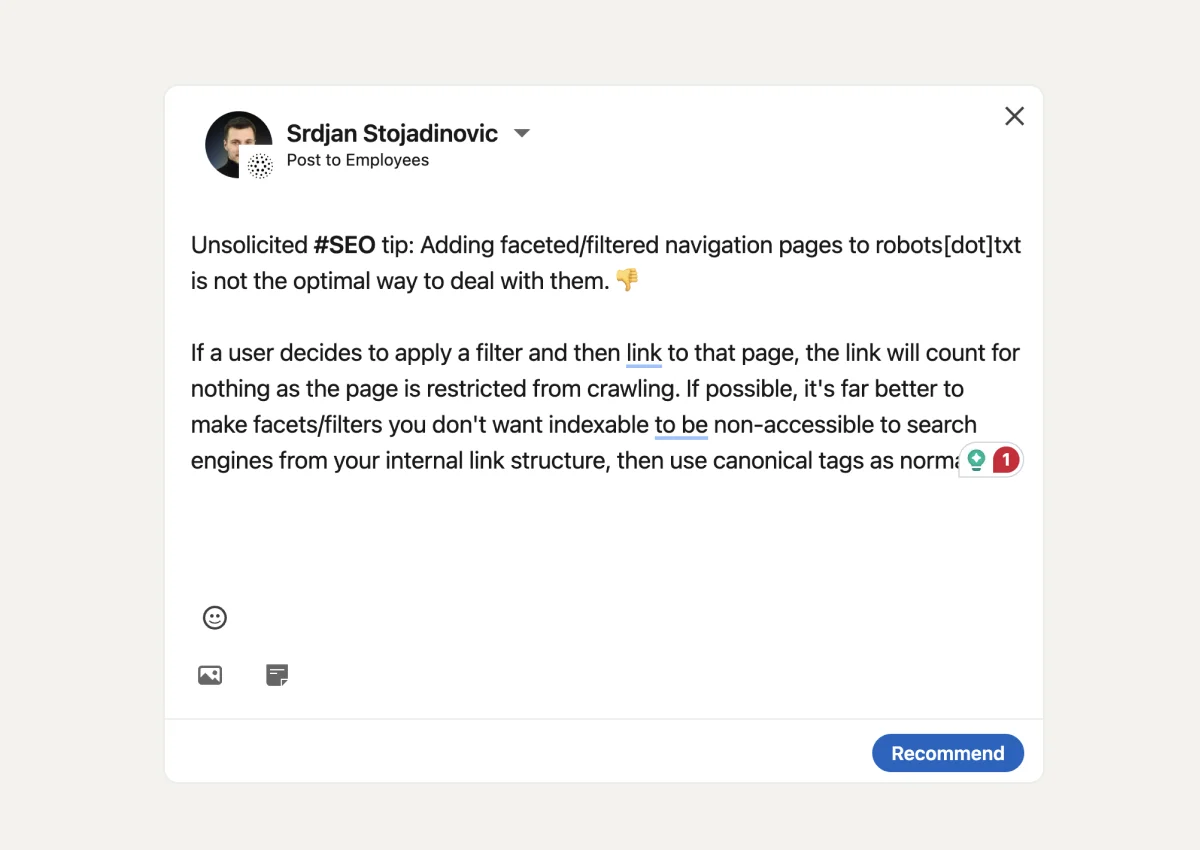
4. On the next screen, select your company to specify who you are recommending the post to.
After selecting your company, click "Done" to finalize the recommendation.
Important Considerations for Employee Advocacy Analytics
👉 It's important to note that Employee Advocacy analytics on LinkedIn might show a different number of posts and reposts compared to what is visible directly on the posts themselves.
👉 This discrepancy can occur when the content is shared within private groups or among specific audiences that are not publicly visible.
Keep this aspect in mind when evaluating the data from these analytics to ensure an accurate understanding of how content is being distributed and engaged with across different segments of your audience.
How to Monitor Your Linkedin Metrics With AuthoredUp?
Congratulations on making it this far!
Mastering LinkedIn metrics is no easy feat. You must first understand these metrics before you can effectively refine your strategy.
If you find these metrics daunting, I have great news: there's a simpler way to track your progress and grasp the data behind your LinkedIn activities.
Introducing AuthoredUp — your comprehensive solution for LinkedIn content creation and analytics.
About AuthoredUp Platform
AuthoredUp is a comprehensive editing and analytics platform designed for enhancing LinkedIn posts.
It combines advanced editing capabilities with powerful analytics to help users optimize their content for maximum engagement and visibility on LinkedIn.
AuthoredUp is available as a web application and Chrome extension.
AuthoredUp — Key Features for Analytics
AuthoredUp offers in-depth analytics that allow users to understand and improve their profile's performance by providing detailed insights into content engagement and effectiveness.
👉 Post Highlight — Analyze individual posts' performance with detailed statistics, mentions, hashtags, and links for a granular view.
👉 Correlation Plot — Explore interconnected graphs to analyze relationships between different engagement metrics like impressions, reactions, and shares.
👉 Reaction Timeline — Gain insights into how different posts resonate with audiences, helping tailor future content to audience preferences.
👉 Hashtags — Evaluate your hashtag strategy with metrics on frequency, comments, reactions, shares, and engagement rates.
👉 Post Type Analysis — Determine which types of posts perform best on your profile to refine your content strategy.
👉 Growth Timeline — Track your LinkedIn performance over time with metrics such as impressions and engagement rates.
AuthoredUp — Other Notable Features
👍 Editor — Enhance posts with tools like bold, italic, bullet points, and emojis for more visually engaging content.
👍 Preview — Visualize how posts will look on various devices before publishing to ensure optimal presentation.
👍 Calendar View — Manage and schedule content directly from an interactive calendar.
👍 Saved Posts — Save and manage content efficiently, allowing for easy post filtering and analysis.
👍 Drafts — Save drafts of posts for later refinement and scheduling.
👍 Hooks — Access over 200 engaging templates to start your posts compellingly.
👍 Endings — Use customizable call-to-action templates to enhance post conversion rates.
👍 Snippets — Save and reuse text segments to streamline content creation.
👍 Reuse Feature — Repurpose successful posts by editing and republishing them.
👍 Scheduling Option — Schedule posts directly within AuthoredUp, including various post types.
👍 Share Draft — Collaborate on posts with team members within the platform.
👍 Readability — Ensure your content is clear and understandable with a readability score.
👍 Word Cloud — Visualize key themes and words from your posts to better understand audience interests.
👍 Snapshot — Access a history of drafts and post versions for easy revision.
How to Get Started With AuthoredUp?
Here are the steps to install and use the AuthoredUp extension:
1. Install the Extension: Add AuthoredUp to your preferred browser.
2. Activate AuthoredUp: Navigate to LinkedIn, start a new post, and turn on the AuthoredUp extension.
3. Use the Enhanced Editor: Once activated, the post editor will upgrade, offering you enhanced features and functionality.
4. Explore Features: On the left side of the editor canvas, you can access various sections of the tool, each tailored for specific functions like drafts, calendar, posts, saved posts, and analytics.
Ready for a ride?
Sign up now for a 14-day free trial, elevate your content strategy effortlessly, and master your LinkedIn metrics with AuthoredUp!